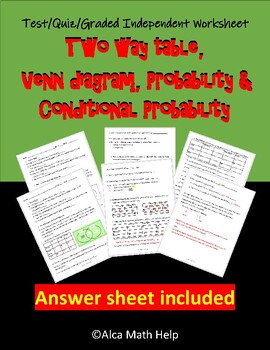
Unit Test/Quiz/Packet- Two-way table, Venn diagram, Conditional Probability
- PDF
Description
If you are looking for an easy to follow for students. You are at the right place. This is a quick and easy to follow activity sheet that brings across the concept clearly and precisely. Teachers in my department love this activity sheet. This is useful for CP Probability and Statistics, AP Statistics and Algebra 1 statistics unit.
5W’s and How of statistics
At the end of the lesson students should be able to:
1. Recall the history of statistics
2. Define the 5W’s and How of statistics with examples
3. Identify the use of the 5W’s and How
4. Evaluate scenarios and note the who, when, where, why and how
5. Explain Data its type and method of collection
6. Classify variables and quantitative in relation to their use.
7. Identify units for quantitative data
Categorical data and Display Variables Objectives
At the end of the lesson students should be able to:
1. Correctly define categorical and quantitative data with examples
2. Label and classify variables as categorical and quantitative
3. Display categorical on pie chart and bar chart
4. Create one way tables using frequency counts and percent
5. Interpret one way and two way tables
6. Differentiate between bar and pie chart based on display and properties
7. State sub categorical data based on main category given
Frequency Tables Objectives
At the end of the lesson students should be able to:
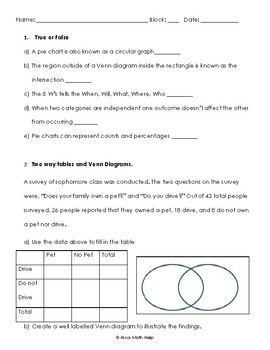
1. Define two way takes with its properties.
2. Create one way tables using frequency counts and percent
3. Interpret two-way tables (label joint and marginal frequencies)
4. Create two-way tables
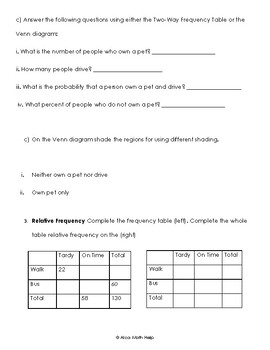
5. Create whole table relative frequency table
Venn diagram Objectives
At the end of the lesson students should be able to:
1. Identify a Venn diagram and its properties.
2. Shade specific regions of the Venn diagram (union, intersection, complement, neither)
3. Interpret and label critical part of a Venn diagram
4. Use two-way table to create Venn diagram vice versa
Probability and Conditional Probability Objectives
At the end of the lesson students should be able to:
1. Interpret two-way tables
2. Create relative frequency tables for whole tables
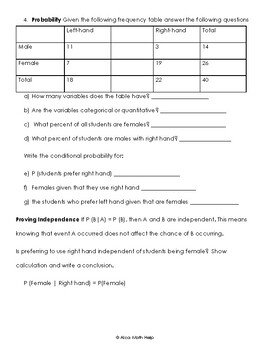
3. Define probability and conditional probability
4. Differentiate the difference between probability and conditional probability
5. Identify marginal frequencies and sample space
6. Examine the association between categorical variables
7. Describe patterns that exist.
8. Prove independence among categorical variables.
9. Write conditional probability statement and summarize them
10. Use probability and conditional probability formulas to solve related questions


