688 results
High school statistics homework pdfs
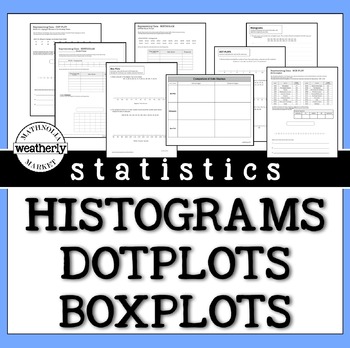
STATISTICS - Histograms, Dot Plots and Box Plots
There is no need to scour the internet for data. This resource includes the data and the format to challenge your students' skills with data displays.This packet includes worksheets that provide opportunities for students to create histograms, dot plots, and box plots.They can be used as guided practice or as "on your own" activities.INCLUDES3 worksheets with realistic data.3 worksheets with REAL data (Apple stock prices, US Olympic athlete ages, and the Oscars:Best Picture/ Movie Times)AND 3 wo
Subjects:
Grades:
6th - 9th
Types:
CCSS:
Two Way Tables Worksheet
Attention Math Teachers! Download this two-sided worksheet on completing two-way tables and analyzing bivariate data today! This worksheet is perfect for Pre-Algebra and Algebra 1 students as a classwork or homework activity.By completing this worksheet, students will check their understanding of how patterns in bivariate data can be seen by displaying frequencies and relative frequencies in a two-way table. They will also learn how to construct and interpret two-way tables, summarizing and inte
Subjects:
Grades:
8th - 9th
Types:
CCSS:
Also included in: Scatterplots Two Way Tables and Residual Plots Worksheets Bundle
Two Way Relative Frequency Tables Worksheet
Are you a math teacher looking for engaging classwork or homework activities to help your students with relative frequency tables? Look no further! Our worksheet on completing two-way tables and creating relative frequency tables is perfect for your needs. Great for Pre-Algebra and Algebra 1 students. With real-world situations and comprehension questions based on relative frequency tables, students will learn to summarize and interpret data collected from the same subjects. They'll construct an
Subjects:
Grades:
8th - 9th
Types:
CCSS:
Also included in: Scatterplots Two Way Tables and Residual Plots Worksheets Bundle
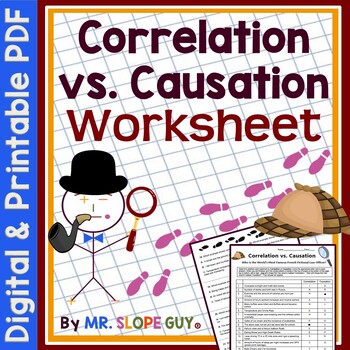
Correlation vs Causation Worksheet
Hello Math Teachers! Help your math students understand the difference between correlation and causation with our fun activity worksheet. Students will evaluate 42 statements and determine whether they demonstrate correlation or causation, and there are some multiple-choice questions as well. This activity also includes a puzzle that generates an answer, making it easy to grade.This two-sided worksheet is great for classwork or homework and is designed to help students develop critical thinking
Subjects:
Grades:
9th
Types:
CCSS:
Also included in: Algebra Math Riddle Worksheets
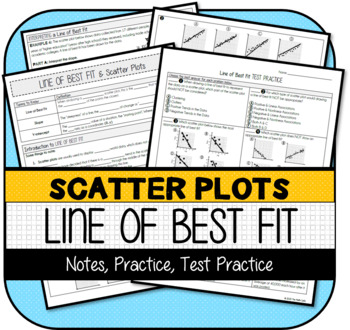
Scatter Plots: Line of Best Fit NOTES & PRACTICE
This resource contains the following items:1) Introduction to Line of Best Fit NOTES & PRACTICE2) Interpreting Line of Best Fit NOTES & PRACTICE3) Line of Best Fit TEST PRACTICE --8 Multiple Choice Questions --Printable --Version for Google Forms (auto-graded)4) Answer Keys to All PartsThis resource was developed to meet the requirements of the 8th Grade Statistics & Probability standards below:CCSS.MATH.CONTENT.8.SP.A.2 Know that straight lines are widely used to model
Subjects:
Grades:
7th - 9th
Also included in: Scatter Plots MINI-BUNDLE
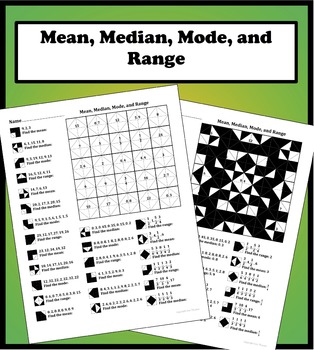
Mean, Median, Mode, and Range Color Worksheet
25 carefully thought out problems on finding the mean, median, mode, and range. The problems start off easy and slowly work their way to more difficult problems including decimals and fractions.
Each question corresponds to a matching answer that gets colored in to form a symmetrical design. Not only does this make it fun and rewarding for students but it also makes it easy for students and teachers to know if the worksheet has been completed correctly. Great for classwork, homework, addition
Subjects:
Grades:
5th - 9th
Types:
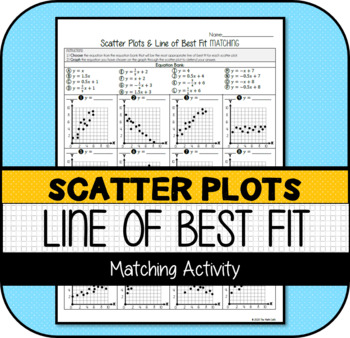
Scatter Plots: Line of Best Fit MATCHING Activity
This resource was developed to partially meet the requirements of the 8th Grade Statistics & Probability standards below (portions met in bold):CCSS.MATH.CONTENT.8.SP.A.2Know that straight lines are widely used to model relationships between two quantitative variables. For scatter plots that suggest a linear association, informally fit a straight line, and informally assess the model fit by judging the closeness of the data points to the line.CCSS.MATH.CONTENT.8.SP.A.3Use the equation of a l
Subjects:
Grades:
7th - 9th
Types:
Also included in: Scatter Plots MINI-BUNDLE
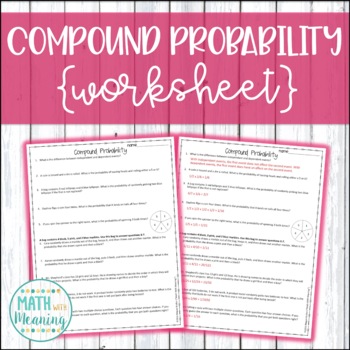
Compound Probability Worksheet - Aligned to CCSS 7.SP.8
This 1-page, 10-question worksheet is a great way for students to practice finding the probability of compound events! It includes both independent and dependent events. Please view the preview file to determine if this product is appropriate for your students!An answer key is included.This activity is aligned to CCSS 7.SP.C.8.Please note that this activity is NOT editable. The text, problems, and images are not able to be changed.**Save money by buying this resource as part of my Compound Proba
Subjects:
Grades:
6th - 9th
Types:
CCSS:
Normal Distributions Empirical Rule Worksheet
Hello Math Teachers! Do you want to help your students understand normal distributions and apply the Empirical Rule (64-95-99.7)? This worksheet can help! Students will practice interpreting real-world examples to find percentages, probability, and estimate data statements from distributions. They will also label parts of normal distributions when given mean and standard deviation, and identify key data points from the graphical distribution of data.This two-sided worksheet comes with an easy-to
Subjects:
Grades:
10th
Types:
CCSS:
Also included in: Data and Statistics Worksheets Bundle
Residuals and Residual Plots Worksheet
Hello Math Teachers! Enhance your students' understanding of residual plots and scatter plots with this exciting activity!This two-sided worksheet focuses on understanding and creating residual plots. Your students will evaluate scatter plots as linear or quadratic, choose which ones should be modeled with linear or quadratic equations, create a scatter plot, write an equation to model data, determine if several residual plots would be a "Good Fit" for data, and calculate and construct a residua
Subjects:
Grades:
9th
Types:
CCSS:
Also included in: Scatterplots Two Way Tables and Residual Plots Worksheets Bundle
Data Analysis and Statistics in Algebra 1 Google Forms Homework and Assessment
This Algebra 1 Google Forms bundle currently includes auto-grading assignments on the following skills related to data analysis and statistics:Measures of Central TendencyDot Plots and HistogramsBox PlotsStandard Deviation and The Empirical RuleTwo-Way Frequency TablesScatter PlotsEach assignment also includes a PDF "worksheet" for students to complete along with the form.All of the assignments in this bundle are also included in my:★ Algebra 1 (Semester 2) Google Forms BundleYou may also be int
Subjects:
Grades:
6th - 9th
CCSS:
Standard Deviation Worksheet
Hello Math Teachers! Enhance your students' understanding of standard deviation, mean, range, and variance with this comprehensive worksheet on calculating standard deviation!This two-sided worksheet includes scaffolded questions to help students begin and interpret similarities and differences using real-world situations. It's perfect for Algebra 1 classes as homework or as a classwork activity, and would be a great addition to any statistics and data analysis unit.This worksheet comes with an
Subjects:
Grades:
10th
Types:
CCSS:
Also included in: Data and Statistics Worksheets Bundle
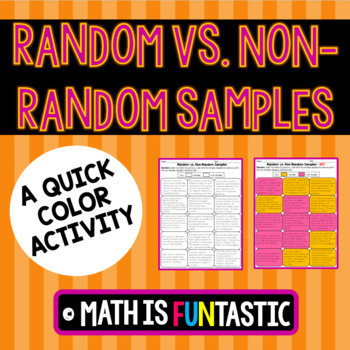
Random vs. Non-Random Samples Quick Color
This ready to use product is a quick, fun way to have your students practice the differentiating between random and non-random samples. Students will be 15 problems and will need to classify each one as random or non-random. Instead of writing their answers, students will color them! You can either choose the colors for them to make it unified across the classroom or let them choose their own. This makes a great visual for your visual learners. This is an extremely easy assignment to grade! It i
Subjects:
Grades:
6th - 9th
Types:
Also included in: 7th Grade Math Quick Color Bundle
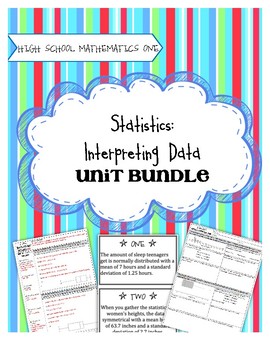
High School Math 1: Statistics and Interpreting Data
Task-Based Learning gets students intrinsically motivated to learn math! No longer do you need to do a song and dance to get kids interested and excited about learning. The tasks included in this unit, followed by solidifying notes and practice activities, will guarantee that students understand the concepts. This unit covers:
- Displaying one-variable data in a histogram, dot plot, or box plot
- Describing the distribution of data using statistical vocabulary
- Using data models and stati
Subjects:
Grades:
8th - 10th
Types:
CCSS:
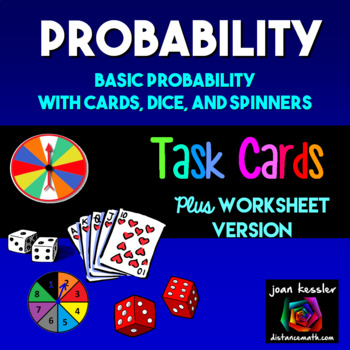
Algebra Statistics Probability Task Cards
This set of 26 Probability Task Cards cards reviews basic probability concepts of independent and dependent events using dice, spinners, and a standard deck of playing cards. These are appropriate for grades 6 - 9. By using a familiar and limited sample space, students will less likely get confused by the rules and be able to grasp the concepts fulfilling the CCS for Probability. They will be learning based on familiar topics, but expand their cognitive thinking skills with the questions asked.
Subjects:
Grades:
6th - 9th
Types:
CCSS:
Also included in: Algebra 2 Activity Bundle
Elementary Statistics Worksheets - Full Course Bundle
Elementary Statistics Worksheets - Full Course BundleThis product includes every worksheet in my Elementary Statistics Curriculum. All answer keys are included. All worksheets are in PDF and Word format.*Note: This product includes worksheets only. All tests are sold separately.Related ContentClick here to view more Elementary Statistics Products----Customer Tips----Get credit for future purchases:Please go to your "My Purchases" page (you may need to login). Beside each purchase you'll see a "P
Subjects:
Grades:
10th - 12th, Higher Education
Types:
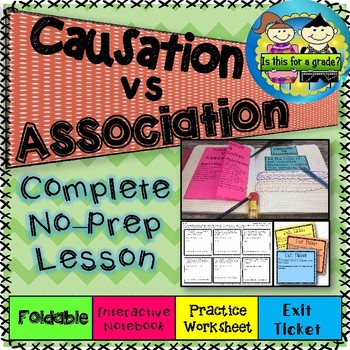
Causation vs Association (Correlation) Foldable, Activity, Practice, & Exit
Complete lesson, start to finish at your finger tips. The lesson introduces differentiating between causation vs association. The foldable is a great guided practice, the interactive notebook is a great way for students to collaborate and create and manipulate, the practice sheet can be used to reinforce, and I find exit tickets KEY to the assessment process. It allows me to see who has it and common misconceptions that I need to fix. What's Included:Foldable NotesInteractive Notebook ActivityPr
Subjects:
Grades:
8th - 12th
CCSS:
Also included in: Linear Functions Mega Bundle: No Prep Foldable Lessons
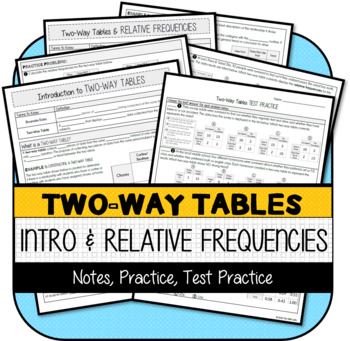
Two-Way Tables: Introduction & Relative Frequencies (NOTES & PRACTICE)
This resource was developed to meet the requirements of the 8th Grade Statistics & Probability standards below:CCSS.MATH.CONTENT.8.SP.A.4 Understand that patterns of association can also be seen in bivariate categorical data by displaying frequencies and relative frequencies in a two-way table. Construct and interpret a two-way table summarizing data on two categorical variables collected from the same subjects. Use relative frequencies calculated for rows or columns to describe possible ass
Subjects:
Grades:
7th - 9th
CCSS:
Also included in: Scatter Plots & Two-Way Tables UNIT BUNDLE
Histograms Interpreting and Creating Worksheet
Hey Math Teachers! This Histograms Worksheet is the perfect resource to help your students master constructing and interpreting histograms. This two-sided Math worksheet includes progressively challenging problems on displaying numerical data using histograms and questions on interpreting histograms. We provide scaffolding to help your students identify the components of a set of data, assess the skew of data, and report the number of observations.This worksheet is suitable for Middle School Mat
Subjects:
Grades:
6th - 9th
Types:
CCSS:
Also included in: Data and Statistics Worksheets Bundle
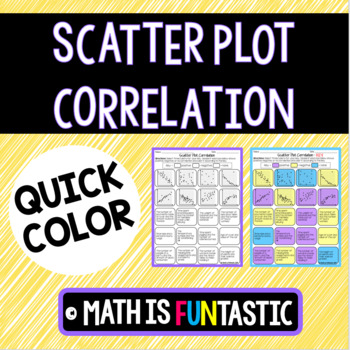
Scatter Plot Correlation Quick Color
This ready to use product is a quick, fun way to have your students practice identifying positive, negative, and no correlation in scatter plots. Students will be given 20 different problems (graphs and verbal descriptions) and will need to classify it as positive, negative, or no correlation. Instead of writing their answers, students will color them! You can either choose the colors for them to make it unified across the classroom or let them choose their own. This is an extremely easy assignm
Subjects:
Grades:
7th - 10th
Types:
CCSS:
Relative Frequency Two Way Tables by Total Row or Column Worksheet
Attention Math Teachers! Enhance your students' understanding of relative frequency tables with our Two-Way Tables Worksheet. This two-sided worksheet is designed to help students create accurate relative frequency tables from basic information given in the form of a two-way table.The worksheet focuses on completing tables when using the totals by either the row or the column equal to 1.00. By practicing this skill, students will strengthen their ability to analyze data and draw conclusions.With
Subjects:
Grades:
8th - 9th
Types:
CCSS:
Also included in: Scatterplots Two Way Tables and Residual Plots Worksheets Bundle
Set Theory - Intersection and Union with Sets and Complements
This self checking worksheet uses the universal set 1 through 10 and sets A, B, C and their complements to work through a series of 14 problems. The student will find the solution to a riddle upon completion.
Subjects:
Grades:
10th - 11th
Types:
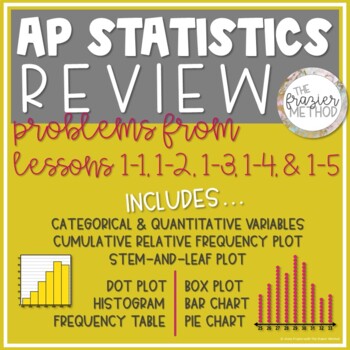
AP Statistics Review - Histogram, Box Plot, Stem-and-Leaf, Bar Graph, Pie Chart
REVIEW OF 1-1, 1-2, 1-3, 1-4, & 1-5 (1 Page, Front & Back)ANSWER KEY INCLUDEDProblems align with The Frazier Method’s Notes from Unit 1: Exploring One-Variable Data:Lesson 1-1: Categorical & Quantitative VariablesLesson 1-2: Displaying 1 Categorical Variable – Frequency Table, Bar Graph, Pie ChartLesson 1-3: Displaying 1 Quantitative Variable Part 1 – Dot Plot, Stem-and-Leaf Plot, HistogramLesson 1-4: Displaying 1 Quantitative Variable Part 2 – Cumulative Relative Frequency PlotLesso
Subjects:
Grades:
9th - 12th
Types:
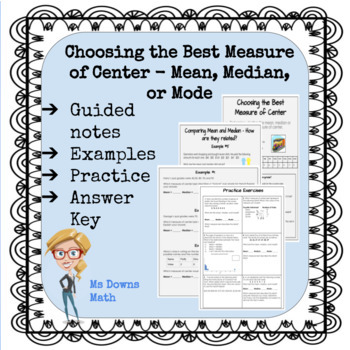
Choosing the Best Measure of Center - Mean, Median or Mode
This lesson is about how to choose which measure of center is best - Mean, Median, or Mode. I use this lesson in my Introduction to Statistics high school course.The guided lesson shows examples with skewed data and without. There is a practice (homework) assignment with 6 questions.An answer key to the entire lesson is provided as well.
Subjects:
Grades:
8th - 12th
Types:
Showing 1-24 of 688 results


