1,307 results
High school statistics worksheet pdfs
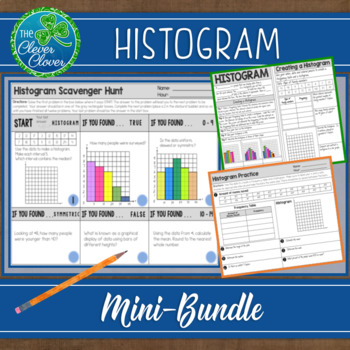
Histogram - Notes, Practice Worksheets and Scavenger Hunt
This histogram resource includes guided notes, a practice worksheet and a scavenger hunt. Your students will have the opportunity to create, interpret and discuss histograms. Below, you will find a detailed description of the notes, worksheet and scavenger hunt. Guided NotesThere are two small pages of guided notes. The first page provides the definition of a histogram and step by step instructions on how to create a histogram. The bottom portion of the notes has students examine three types (un
Subjects:
Grades:
6th - 9th, Adult Education
CCSS:
Also included in: Statistics Bundle - Guided Notes, Worksheets & Scavenger Hunts!
Two Way Relative Frequency Tables Worksheet
Are you a math teacher looking for engaging classwork or homework activities to help your students with relative frequency tables? Look no further! Our worksheet on completing two-way tables and creating relative frequency tables is perfect for your needs. Great for Pre-Algebra and Algebra 1 students. With real-world situations and comprehension questions based on relative frequency tables, students will learn to summarize and interpret data collected from the same subjects. They'll construct an
Subjects:
Grades:
8th - 9th
Types:
CCSS:
Also included in: Scatterplots Two Way Tables and Residual Plots Worksheets Bundle
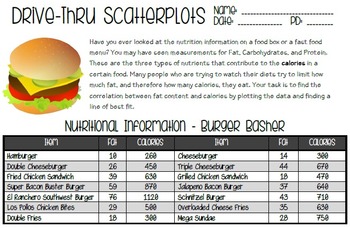
Drivethru Scatter Plots - Line of Best Fit Activity
This activity is a fun way to work with scatter plots in a realistic situation. Students will compare the fat and calories in items from a fictional fast food restaurant by creating a scatter plot. They will also draw a line of best fit, approximate the slope of that line, and make predictions based on the line.
Included:
*Drive-Thru Scatterplots Activity
*Answer Key
Please leave feedback with any suggestions for improvements! :)
Subjects:
Grades:
8th - 9th
Types:
Correlation vs Causation Worksheet
Hello Math Teachers! Help your math students understand the difference between correlation and causation with our fun activity worksheet. Students will evaluate 42 statements and determine whether they demonstrate correlation or causation, and there are some multiple-choice questions as well. This activity also includes a puzzle that generates an answer, making it easy to grade.This two-sided worksheet is great for classwork or homework and is designed to help students develop critical thinking
Subjects:
Grades:
9th
Types:
CCSS:
Also included in: Algebra Math Riddle Worksheets
Two Way Tables Worksheet
Attention Math Teachers! Download this two-sided worksheet on completing two-way tables and analyzing bivariate data today! This worksheet is perfect for Pre-Algebra and Algebra 1 students as a classwork or homework activity.By completing this worksheet, students will check their understanding of how patterns in bivariate data can be seen by displaying frequencies and relative frequencies in a two-way table. They will also learn how to construct and interpret two-way tables, summarizing and inte
Subjects:
Grades:
8th - 9th
Types:
CCSS:
Also included in: Scatterplots Two Way Tables and Residual Plots Worksheets Bundle
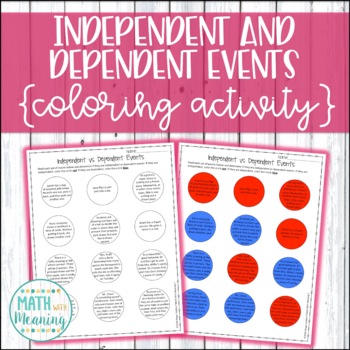
Independent and Dependent Events Coloring Activity - Compound Probability
Take a break from typical worksheets with this coloring activity! Students will read 12 sets of compound events and determine if they are independent or dependent events. Many examples of real-world events are included. This is a great activity for students learning compound probability who struggle with differentiating between independent and dependent events.Two versions of the activity are included: one that asks students to use the colors red and blue for uniformity and easy grading, and one
Subjects:
Grades:
6th - 9th
Types:
CCSS:
Estimating Correlation Coefficient with Scatter Plots Worksheet
Attention Math Teachers! Are you looking for a way to help your students master estimating correlation? Look no further! Our engaging worksheet is designed to match scatter plots with the correct correlation coefficient. With a variety of reasonable choices, students will estimate the correct r value and interpret positive and negative slope, as well as the strength or weakness of the correlation coefficient of a linear fit.This two-sided worksheet comes with an easy-to-use key and is perfect fo
Subjects:
Grades:
9th
Types:
CCSS:
Also included in: Data and Statistics Worksheets Bundle
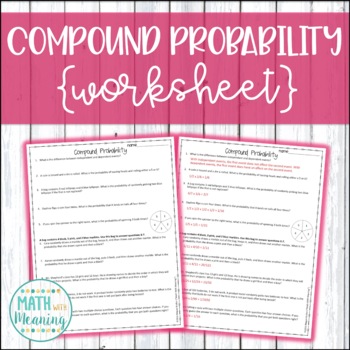
Compound Probability Worksheet - Aligned to CCSS 7.SP.8
This 1-page, 10-question worksheet is a great way for students to practice finding the probability of compound events! It includes both independent and dependent events. Please view the preview file to determine if this product is appropriate for your students!An answer key is included.This activity is aligned to CCSS 7.SP.C.8.Please note that this activity is NOT editable. The text, problems, and images are not able to be changed.**Save money by buying this resource as part of my Compound Proba
Subjects:
Grades:
6th - 9th
Types:
CCSS:
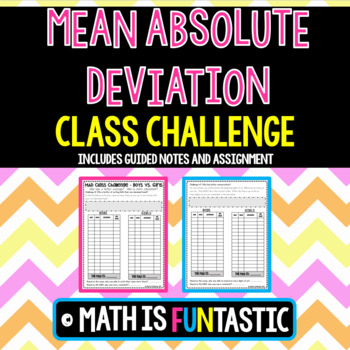
Mean Absolute Deviation - Class Challenge
Are you looking for an engaging way to teach Mean Absolute Deviation? Look no further! My students love completing this lesson.
This product is designed to help your students master the MAD in three easy steps.
1) Guided Notes – The guided notes contain an introduction to calculating MAD. Students will write the overall meaning of the MAD and the steps to calculating. There is an example problem for the teacher to model and then two “you try” problems for students to try independently a
Subjects:
Grades:
6th - 9th
Types:
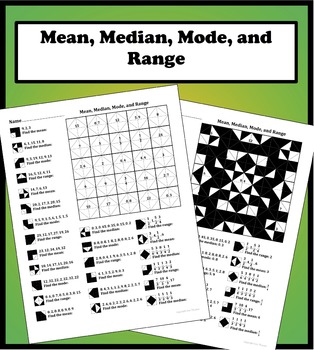
Mean, Median, Mode, and Range Color Worksheet
25 carefully thought out problems on finding the mean, median, mode, and range. The problems start off easy and slowly work their way to more difficult problems including decimals and fractions.
Each question corresponds to a matching answer that gets colored in to form a symmetrical design. Not only does this make it fun and rewarding for students but it also makes it easy for students and teachers to know if the worksheet has been completed correctly. Great for classwork, homework, addition
Subjects:
Grades:
5th - 9th
Types:
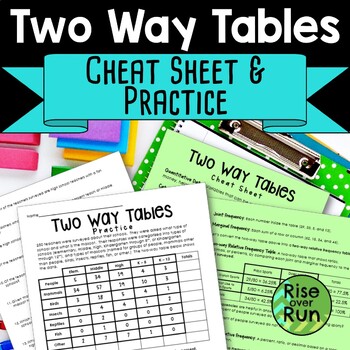
Two Way Frequency Tables Guided Notes and Practice Worksheet
Need an engaging way to get students learning about two way tables and bivariate data? This set of fill-in cheat sheets and practice helps students make sense of data and statistics represent in 2 way frequency tables. This set includes:Two Way Tables Cheat Sheets (2 Pages)These handouts have blanks to fill in with important vocabulary terms and examples of two way frequency tables. Questions are included too. This works great to fill out as a class to give students a solid foundation to und
Subjects:
Grades:
8th - 9th
CCSS:
Also included in: 8th Grade Math Activities & Lessons Bundle for the Whole Year
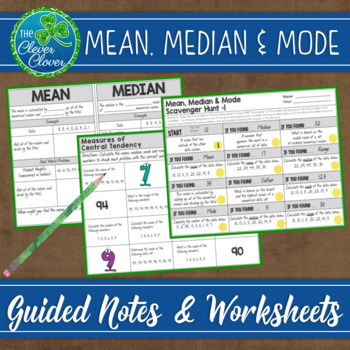
Measures of Central Tendency - Guided Notes, Worksheets and Scavenger Hunts
This resource includes guided notes, practice worksheets and two scavenger hunts on the measures of central tendency. Students will have a deep understanding of the averages, range and outliers after you implement this unit. Below you will find a detailed description of the guided notes, worksheets and the scavenger hunts.
Guided Notes
Four half pages of notes provide the definition and two practice problems for the mean, median and mode. Students will fill in key words and will calculate the
Subjects:
Grades:
6th - 9th
Also included in: Statistics Bundle - Guided Notes, Worksheets & Scavenger Hunts!
Analyzing Plots, Graphs, and Tables using Measures of Central Tendency
This product provides students the opportunity to analyze data presented in different ways. By making calculations and analyzing data, students make conjectures and justify them using mathematical reasoning and evidence!What is included?This product contains 8 student work pages. Each work page contains a set of data displayed graphically with accompanying questions. The data displays included are 2 dot plots, 2 bar graphs, 2 frequency tables, and 2 stem-and-leaf plots. Students are required
Subjects:
Grades:
5th - 11th
Types:
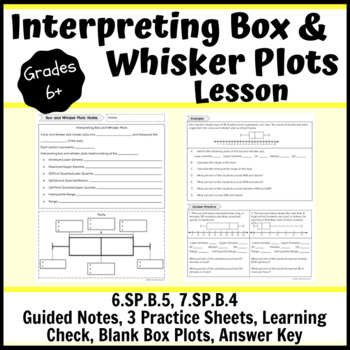
Interpreting Box and Whisker Plots Lesson- Notes, Practice, Learning Check
This interpreting box and whisker plots lesson consists of a guided notes sheet, 3 practice sheets, a learning check, 2 different half sheets of blank box plots and an answer key. You can hole punch the note pages and have students place them in their binders or a 3-prong folder. There are teacher notes to guide you through the direct instruction with students. There are three pages of practice. One page can be used as independent practice when students are ready; this could be in class or homew
Subjects:
Grades:
6th - 10th
Types:
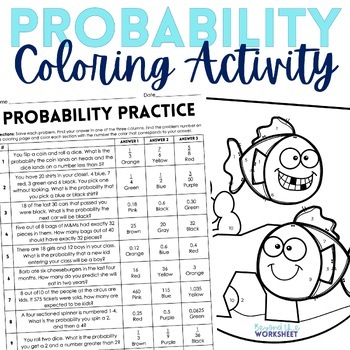
Probability Coloring Math Activity | Coloring Worksheet
⭐️ This coloring activity requires student to find the probability of independent events. It's a wonderful activity that incorporates fun into the classroom! Use it as a quick probability assessment tool, a homework assignment, or even something for the kids to do after a test. Answer Key Included.⭐️ If you'd like these questions in a digital, drag and drop activity format - CLICK HERE!✅ Available as part of the following bundles: Middle School Math Coloring PagesBeyond The Worksheet Again7th
Subjects:
Grades:
6th - 9th
Types:
Also included in: 7th Grade Math Curriculum Supplemental Activities Bundle
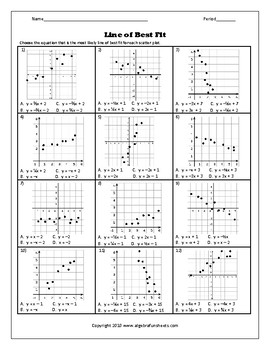
Linear Equations - Scatter Plots and Line of Best Fit Worksheet 2
This is a linear equations scatter plots and line of best fit worksheet.Standard worksheetMultiple choiceNo calculations requiredFrom a scatter plot graph, students will pick the equation that is most likely the line of best fit.This product is included in the Linear and Quadratic Regression Bundle* If you are already an Algebrafunsheets.com subscriber, you already have access to this and over 400+ worksheets. ** Worksheets are copyright material and are intended for use in the classroom only.
Subjects:
Grades:
7th - 11th
Types:
Also included in: Line of Best Fit and Quadratic Regression (Bundle)
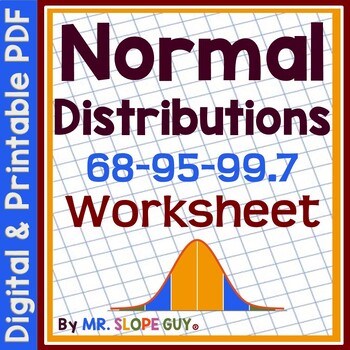
Normal Distributions Empirical Rule Worksheet
Hello Math Teachers! Do you want to help your students understand normal distributions and apply the Empirical Rule (64-95-99.7)? This worksheet can help! Students will practice interpreting real-world examples to find percentages, probability, and estimate data statements from distributions. They will also label parts of normal distributions when given mean and standard deviation, and identify key data points from the graphical distribution of data.This two-sided worksheet comes with an easy-to
Subjects:
Grades:
10th
Types:
CCSS:
Also included in: Data and Statistics Worksheets Bundle
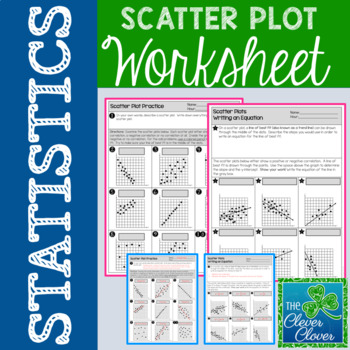
Scatter Plot Worksheet
Scatter Plot Worksheet
This resource allows students to explore scatterplots with a two page worksheet. Students are asked to define scatterplots in their own words. Nine questions ask students to identify the type of correlation (positive, negative or no correlation) that exists between two variables. Students are also asked to describe the steps used to write an equation for the line of best fit. Six additional questions require students to calculate the slope and determine the y-intercept
Subjects:
Grades:
6th - 9th, Adult Education
Types:
CCSS:
Also included in: Scatter Plot Mini-Bundle
Examining Effects of Outliers on Measures of Central Tendency
This 10-page document contains 3 real-life data sets. For each data set, students are guided through an exploration of how outliers in data affect mean, median, mode, and range. Each data set requires students to perform calculations and analyze data. Students will make conjectures and justify them in writing using mathematical reasoning and evidence.
At the end of the activity, students are asked several concluding questions that require them to analyze and evaluate their work. They focus
Subjects:
Grades:
5th - 9th
Types:
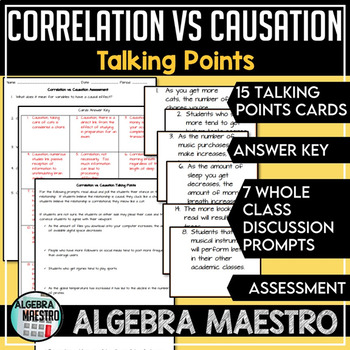
Correlation vs. Causation Talking Points, Prompt & Assessment
The Correlation vs. Causation Talking Points includes task cards, prompts to incorporate discussion, and an assessment. The task cards and assessment have answer keys attached with brief explanations. There are 15 task cards where students can work individually, pairs, or small groups identifying whether cards form a correlation or causation relationship. In the Talking Points, this is designed to be whole class where students take a side on what they believe a passage to be. The assessment
Subjects:
Grades:
5th - 12th
Types:
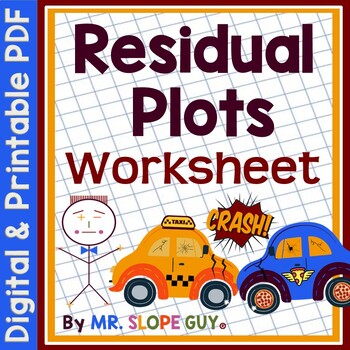
Residuals and Residual Plots Worksheet
Hello Math Teachers! Enhance your students' understanding of residual plots and scatter plots with this exciting activity!This two-sided worksheet focuses on understanding and creating residual plots. Your students will evaluate scatter plots as linear or quadratic, choose which ones should be modeled with linear or quadratic equations, create a scatter plot, write an equation to model data, determine if several residual plots would be a "Good Fit" for data, and calculate and construct a residua
Subjects:
Grades:
9th
Types:
CCSS:
Also included in: Scatterplots Two Way Tables and Residual Plots Worksheets Bundle
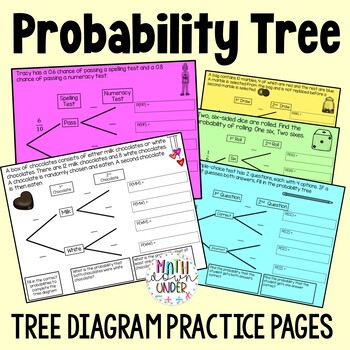
Probability Tree Diagrams Practice Pages - Independent and Dependent Events
Your students will love practicing drawing tree diagrams to solve compound probability events with these 10 printable practice pages. Independent and Dependent events are included.Starting with structured scaffolding, students are introduced to the process of creating probability trees by filling in the blanks. This approach builds confidence and ensures students grasp the fundamentals before advancing. Gradually, the scaffolding is removed, presenting blank templates that encourage students to
Subjects:
Grades:
6th - 10th
Types:
Also included in: Compound Probability Activity & Practice Bundle
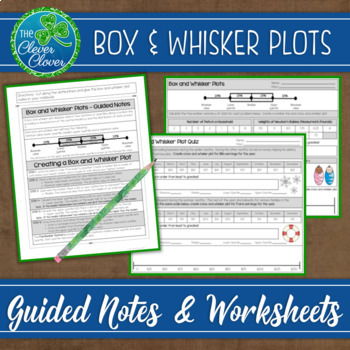
Box and Whisker Plots: Notes, Worksheets and an Assessment
This resource includes detailed step by step notes on how to create a box and whisker plot, a worksheet and an assessment.
The notes include step by step instructions that can be referenced as students study box plots. Students can glue the notes directly into their notebooks. A box and whisker plot visual is used to display the four quartiles of data. As students complete each step, they will determine the five-number summary used to create a box and whisker plot. The guided notes address
Subjects:
Grades:
6th - 9th
Also included in: Statistics Bundle - Guided Notes, Worksheets & Scavenger Hunts!
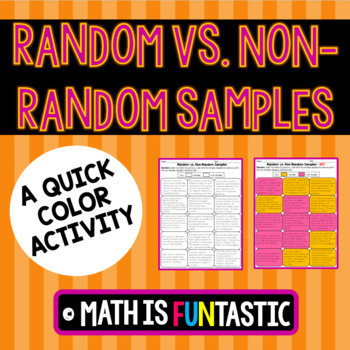
Random vs. Non-Random Samples Quick Color
This ready to use product is a quick, fun way to have your students practice the differentiating between random and non-random samples. Students will be 15 problems and will need to classify each one as random or non-random. Instead of writing their answers, students will color them! You can either choose the colors for them to make it unified across the classroom or let them choose their own. This makes a great visual for your visual learners. This is an extremely easy assignment to grade! It i
Subjects:
Grades:
6th - 9th
Types:
Also included in: 7th Grade Math Quick Color Bundle
Showing 1-24 of 1,307 results


