Linear Functions Mega Bundle: No Prep Foldable Lessons
Is this for a grade
269 Followers
Resource Type
Standards
CCSS8.SP.A.1
CCSS8.SP.A.2
CCSS8.SP.A.3
CCSS8.EE.B.5
CCSS8.EE.B.6
Formats Included
- Zip
Pages
170 pages
Is this for a grade
269 Followers
Products in this Bundle (22)
showing 1-5 of 22 products
Bonus
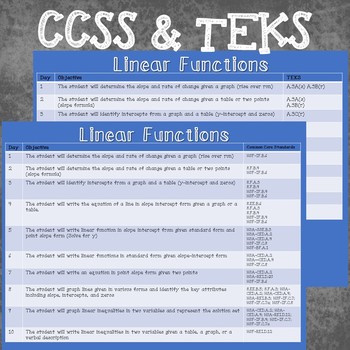
Day by Day Student Objectives with CCSS and TEKS
Description
20 Linear Function topics, 21 resources. 20 complete NO PREP foldable lessons. For a completel list of topics click the green preview button below the thumbnails.
What's Included in Each Lesson:
*Foldable Notes
*Interactive Notebook
*Practice Worksheet
*Exit Ticket
*Keys & Pictures
Systems of equations task card activity is also included.
BONUS day break down of student objective with CCSS and TEKS for easy lesson planning.
Your time is precious! Save time using my NO PREP lessons by visiting my store, Is This For A Grade?
Be sure to Follow Me for updates on resources, bundles, and specials in my store!
Total Pages
170 pages
Answer Key
Included
Teaching Duration
N/A
Report this resource to TPT
Reported resources will be reviewed by our team. Report this resource to let us know if this resource violates TPT’s content guidelines.
Standards
to see state-specific standards (only available in the US).
CCSS8.SP.A.1
Construct and interpret scatter plots for bivariate measurement data to investigate patterns of association between two quantities. Describe patterns such as clustering, outliers, positive or negative association, linear association, and nonlinear association.
CCSS8.SP.A.2
Know that straight lines are widely used to model relationships between two quantitative variables. For scatter plots that suggest a linear association, informally fit a straight line, and informally assess the model fit by judging the closeness of the data points to the line.
CCSS8.SP.A.3
Use the equation of a linear model to solve problems in the context of bivariate measurement data, interpreting the slope and intercept. For example, in a linear model for a biology experiment, interpret a slope of 1.5 cm/hr as meaning that an additional hour of sunlight each day is associated with an additional 1.5 cm in mature plant height.
CCSS8.EE.B.5
Graph proportional relationships, interpreting the unit rate as the slope of the graph. Compare two different proportional relationships represented in different ways. For example, compare a distance-time graph to a distance-time equation to determine which of two moving objects has greater speed.
CCSS8.EE.B.6
Use similar triangles to explain why the slope m is the same between any two distinct points on a non-vertical line in the coordinate plane; derive the equation 𝘺 = 𝘮𝘹 for a line through the origin and the equation 𝘺 = 𝘮𝘹 + 𝘣 for a line intercepting the vertical axis at 𝘣.


