
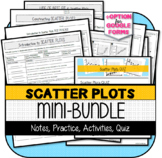
Scatter Plots: Line of Best Fit NOTES & PRACTICE


- PDF
What educators are saying
Also included in
 NOTE: Google Apps Options - Only the ASSESSMENTS have Google Apps options. This bundle is NOT ideal for "Distance Learning" unless you have special access to PDF editors that remove answer keys, etc.This resource was developed to meet the requirements of the 8th Grade Statistics & Probability StPrice $4.00Original Price $5.50Save $1.50
 NOTE: Google Apps Options - Only the ASSESSMENTS have Google Apps options. This unit is NOT ideal for "Distance Learning" unless you have special access to PDF editors that remove answer keys, etc.This resource was developed to meet the requirements of the 8th Grade Statistics & Probability StanPrice $10.00Original Price $14.50Save $4.50
 Does your state have additional standards that are not included in this resource? Email me at tptmathcafe@gmail.com for supplemental resourcesNOTE: Google Apps Options - Only the ASSESSMENTS and a few other specified activities have Google Apps options. This curriculum is NOT ideal for "Distance LeaPrice $175.00Original Price $272.99Save $97.99
 This 8th Grade Math Full-Year Curriculum follows CCSS and includes notes and assessments for every standard. This would be considered an "Essentials Only" bundle, without extra practice or activities.If you are looking to reinforce the topics taught here with extra practice, activities, review, andPrice $100.00Original Price $149.50Save $49.50
Description
This resource contains the following items:
1) Introduction to Line of Best Fit NOTES & PRACTICE
2) Interpreting Line of Best Fit NOTES & PRACTICE
3) Line of Best Fit TEST PRACTICE
--8 Multiple Choice Questions
--Printable
--Version for Google Forms (auto-graded)
4) Answer Keys to All Parts
This resource was developed to meet the requirements of the 8th Grade Statistics & Probability standards below:
CCSS.MATH.CONTENT.8.SP.A.2 Know that straight lines are widely used to model relationships between two quantitative variables. For scatter plots that suggest a linear association, informally fit a straight line, and informally assess the model fit by judging the closeness of the data points to the line.
CCSS.MATH.CONTENT.8.SP.A.3 Use the equation of a linear model to solve problems in the context of bivariate measurement data, interpreting the slope and intercept. For example, in a linear model for a biology experiment, interpret a slope of 1.5 cm/hr as meaning that an additional hour of sunlight each day is associated with an additional 1.5 cm in mature plant height.
LICENSING TERMS: This purchase includes a license for one teacher only for personal use in their classroom. Licenses are non-transferable, meaning they can not be passed from one teacher to another. No part of this resource is to be shared with colleagues or used by an entire grade level, school, or district without purchasing the proper number of licenses.
COPYRIGHT TERMS: This resource may not be uploaded to the internet in any form, including classroom/personal websites or network drives, unless the site is password protected and can only be accessed by students.
