252 results
High school statistics project pdfs
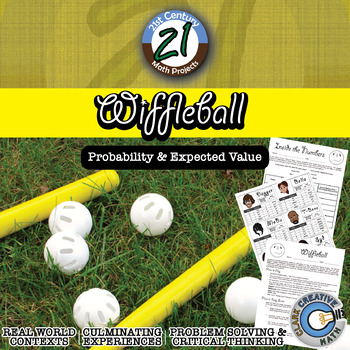
Wiffleball -- Theoretical & Experimental Probability - 21st Century Math Project
Theoretical and Experimental Probability gets a 21st Century Math Project facelift in this interactive game. Tired of flipping coins and spinning spinners? Students play the role of team managers and with only player statistics they must build a team capable of winning the championship. Students will plays a series of Wiffleball games where they will keep track of statistics using a baseball/softball inspired scorebook and after the game crunch the number to see if their players performed up to
Subjects:
Grades:
6th - 12th
Types:
Also included in: Probability & Expected Value Unit Bundle - Distance Learning Compatible
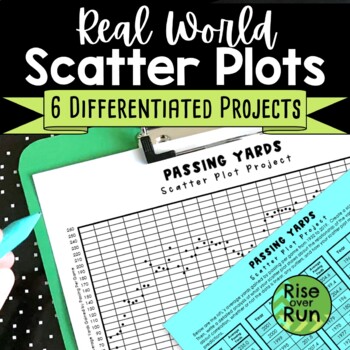
Scatter Plot Project with Real World Sports Data
Practice creating and analyzing scatter plots with these six differentiated real world projects. Students are provided statistics for a sport and must graph the data. Then, they write an analysis describing correlation, whether or not the data is linear, any outliers, and how the scatter plot might be used to make predictions. The scatterplots range from 38 points to 149 points, so they can be used to differentiate. The scatter plots will take a little time to plot, but they result in real
Subjects:
Grades:
8th - 9th
Types:
CCSS:
Also included in: 8th Grade Math Activities & Lessons Bundle for the Whole Year
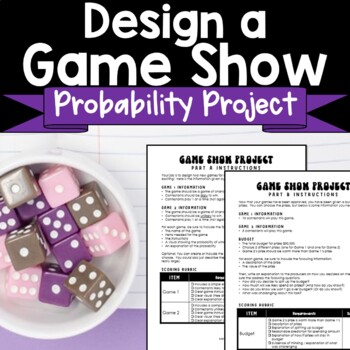
Probability Project Design a Gameshow Game
Look for fun probability activities? Students get creative as they design games for gameshows in this engaging project about simple and compound probability! Instructions are included to guide students in completing the following:Design a game based on a simple eventDesign a game based on a compound eventExplain the probabilities of winningChoose prizes based on a budget and probabilities of winningThe project is split into 2 parts with a rubric for grading each one.You might provide students so
Subjects:
Grades:
7th - 10th
Types:
Also included in: 7th Grade Math Activities, Lessons, Projects & More Bundle
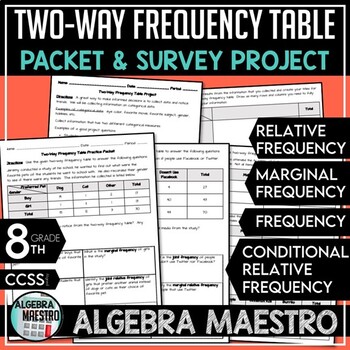
Two-Way Frequency Table Practice Packet & Project
With the Two-Way Frequency Table (or two way tables) Practice Packet & Project you'll receive:-3 pages of student practice via packet-3 pages of the answer key for the packet-2 pages for the student driven projectThe Two-Way Frequency Table Packet and Project are meant to be a review and reinforcement activity. Students can practice and further enhance their understanding using the Packet Practice. Teacher may want to further differentiate the content for advanced students and give them th
Subjects:
Grades:
7th - 12th, Higher Education, Adult Education
Types:
CCSS:
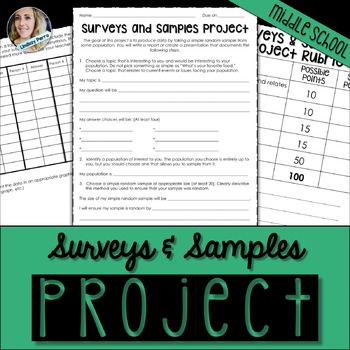
Surveys and Samples Math Project
About this resource :
This surveys and samples project has students create a survey question, deliver it to a population of interest, chart, graph and discuss the results. The project is 3 pages long, giving students space to work and show their results. A rubric is included.
Available as part of the following bundles :
Middle School Math Activities Bundle
7th Grade Math Curriculum Resources Mega Bundle
Licensing Terms :
By purchasing this product, you own a license for one teacher only for
Subjects:
Grades:
7th - 11th
Types:
Also included in: 7th Grade Math Curriculum Supplemental Activities Bundle
8th Grade Statistics Project- Scatter Plots: Analyzing Asthma
I created this project as a fun way for my 8th grade students to apply their knowledge of scatter plots in a meaningful way. They had a lot of fun!Students pretend to be biostatisticians investigating why asthma rates in a city are skyrocketing. Students get to uncover the environmental cause of the increased rates of asthma and investigate how different factors are associated with asthma attacks.Students get lots of practice: - creating scatter plots using a table of data- selecting an appropri
Subjects:
Grades:
8th - 10th
Types:
CCSS:
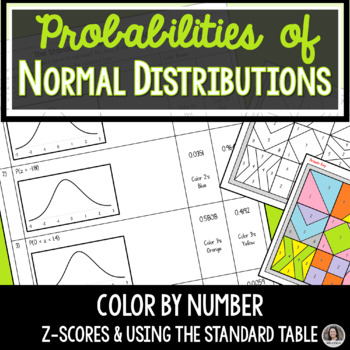
Probabilities of Normal Distribution, Z Scores Activity Project
Students shade the area under the normal distribution curve and determine the probabilities for the given z-scores in this color by number activity. Their answers will determine what color they will need to use to color the provided image. This self-checking activity allows students to work independently to practice their understanding of using The Standard Table to determine probabilities of normal distributions.The color by number activity can be assigned in a variety of ways. 1. Assign The S
Subjects:
Grades:
6th - 12th, Higher Education
Types:
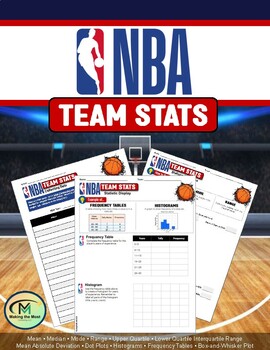
NBA Team Stats (Mean, Range, Median, Interquartile Range, Box Plots, Histograms)
This guided practice worksheet connects basic statistics with students' favorite NBA teams. Students are required to find the mean, range, median, and interquartile range (with box-and-whisker plot) of their favorite team's players' age, weight, and years in the NBA. Your students will love this engaging activity.
Subjects:
Grades:
6th - 12th
Types:
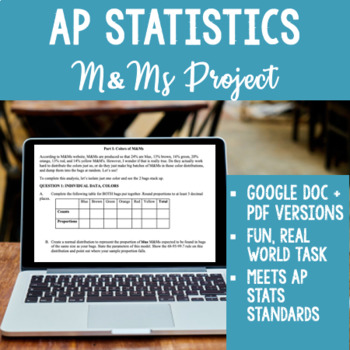
AP Statistics M&M Sampling Distribution Project - Works for Distance Learning!
NEW for 2020! This resource now includes both a PDF for printing out a physical copy AND a fully editable Google Doc link for remote or distance learning! Assign the Google doc to your students, and they can type their answers directly into the document and submit their work digitally. They can also create normal curve diagrams in Google Docs using Insert-Image (kids figure out how to do this quite quickly, as I learned this year!)I use this project every year in my AP Statistics class to demyst
Subjects:
Grades:
10th - 12th
Types:
Also included in: AP Statistics Project Bundle! 6 Projects + digital versions
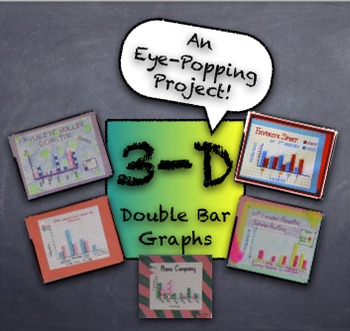
3-D Double Bar Graphs PROJECT from Student Generated Survey Data - Fun Project
This project creates quite an impressive product with simple supplies easily accessible in any classroom. Students generate data from surveys given to peers, using simple questions like, "What's your favorite pizza topping?" Students use survey results to create a 3-dimensional "girls versus boys" double-bar graph. Using centimeter graph paper, markers, and glue sticks, the double-bar graph projects are truly eye-popping! Project description, survey information, and graph assembly instructio
Subjects:
Grades:
3rd - 12th, Adult Education
Types:
Statistics Projects: Collecting Authentic Data for Graphing and Analysis
Engage your students in Statistics. Students generate their own statistical question and then collect authentic data to graph, calculate and reflect upon the results. This is a great activity for a Back to School Project! It works well as a stand-alone Statistics project anytime during the year. This project aligns well to Common Core Standards for Math. Included in this package are:-measures of center (mean, median, mode)-range-bar and line graphing-data collections -reflective questions f
Subjects:
Grades:
5th - 9th
Types:
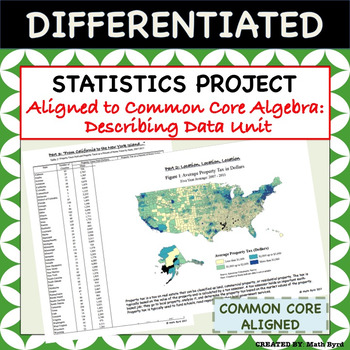
Statistics Project - Aligned to Common Core Algebra - Describing Data Unit
This differentiated U.S. Home Energy & Tax Themed Statistics Project covers all of the "describing data" standards of the Common Core Algebra Course using real data! Students will analyze various forms of tables & graphics to make inferences and interpret the data. The project is perfect for use as a summative assessment since students are required to justify their findings in open-ended format. Allow students to work in pairs, small groups, or individually! A grading rubric and selected
Subjects:
Grades:
8th - 11th
Types:
CCSS:
Also included in: Common Core Algebra 1 PROJECTS - BUNDLE PRICE!

Statistics Survey Project - Project Based Learning (PBL) with Math
Watch your students dive into the world of math as they create, execute, and analyze their own survey! Students will demonstrate mastery of data gathering, survey sampling, developing appropriate survey questions, data tables, Direct Variation, discrete graphs, dot plots, box and whisker graphs, and calculating the inter-quartile range.The Unique Survey Project is highly engaging, capitalizing on the innate curiosity of the adolescent mind. You will love the low-prep instructional guide. Your st
Subjects:
Grades:
6th - 10th
Types:
Also included in: Fun with Ratios Activities Bundle - 7th Grade PBL with Math
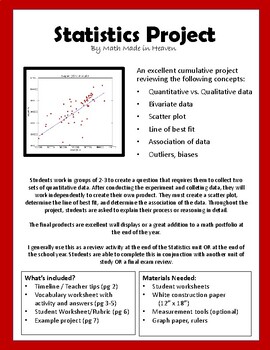
Statistics Project: scatter plot, line of best fit, association of data
An excellent cumulative project reviewing the following concepts: •Quantitative vs. Qualitative data•Bivariate data•Scatter plot•Line of best fit•Association of data (strong, weak, linear, non-linear, positive, and negative)•Outliers, biases, population, sample groupStudents work in small groups to create a question that requires them to collect two sets of quantitative data. After planning and conducting the experiment and collecting data, they will work independently to create their own produc
Subjects:
Grades:
7th - 10th
Types:
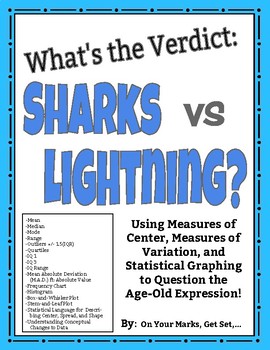
What's the Verdict: Sharks vs. Lightning? Modes of Center, Spread, and More!
Put it to the test! Use the age-old expression: "You are more likely to get struck by lightning than to be bitten by a shark!" to learn and practice Measures of Center, Measures of Spread, Measures of Shape, and Statistical Graphing including:MEANMEDIANMODERANGEOUTLIERS [Using IQR +/- 1.5(IQR)]QUARTILES [lower quartile (IQ-1) and upper quartile (IQ-3)]INTERQUARTILE RANGE (IQR)MEAN ABSOLUTE DEVIATION/ M.A.D. ft. ABSOLUTE VALUESYMMETRY/ASYMMETRY OF DISTRIBUTIONCLUSTERS AND GAPSBELL SHAPED CURVE AN
Subjects:
Grades:
5th - 12th, Higher Education, Adult Education
Types:
March Madness Math Statistics Activity
Students will choose their own team in the March Madness tournament and find the data landmarks for the points that team scored throughout the year. Students will also be asked to create a histogram using the points the team scored throughout the year.
*One modification - If you prefer you can give your students a few teams to pick from instead of allowing them to choose ANY team.
Subjects:
Grades:
5th - 12th
Types:
Probability and Carnival Games STEM Activity Challenge for Middle and High
Take your middle school students' math skills to the next level with our exciting Probability and The Crooked Carnival project pack! Great for END OF YEAR! Or, for ANYTIME!Looking for a comprehensive and engaging way to teach probability to your middle and high school students? Our Probability project pack is the perfect solution! With hands-on activities, worksheets, and challenges, this project pack incorporates important probability concepts such as theoretical and experimental probability, s
Subjects:
Grades:
6th - 12th
Types:
Also included in: Mathematics STEM STEAM Challenges and Activities Bundle
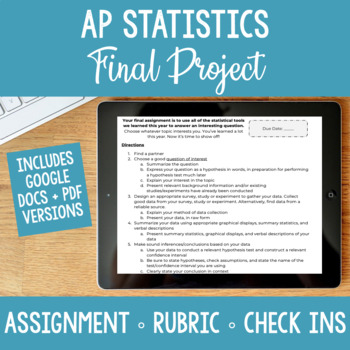
AP Statistics Final Project EDITABLE and NO PREP
Have some extra class time after the AP Stats exam and want to provide your students with a meaningful culminating statistics task? Show them just how powerful statistics is by challenging your students to come up with their own research question and use statistics to answer it. Then, prepare yourself for something amazing - your students will astound you with their creativity, passion and engagement! The project requires student to apply their knowledge of data collection, data analysis, probab
Subjects:
Grades:
10th - 12th
Types:
Also included in: AP Statistics Project Bundle! 6 Projects + digital versions
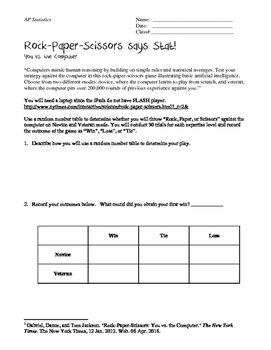
Rock, Paper, Scissors says Stat: A Chi-Square Lab
Students will utilize a Rock, Paper, Scissors website provided by the New York Times to determine whether the computer throwing Rock, Paper, Scissors is truly random. Students are asked to play the game 30 times in both modes. In addition, students are asked to call back ideas of simulation and probability to review previous learned concepts in preparation for the AP Exam to eliminate the confounding variables associated with human behavior.Please find an updated link to the simulator here: ht
Subjects:
Grades:
9th - 12th, Higher Education
Types:
Baseball Statistics Project - Histograms, Box-and-Whisker, and Frequency Tables
Capture your sports fanatic students in this fun baseball statistics project! All stats in this project are accurate to the 2023 MLB season, for five teams. Students will compare and analyze different baseball statistics for 5 real MLB teams, by creating box-and-whisker plots, frequency tables, histograms, and two-way tables. Each section of the project can be done multiple times as the students choose different teams to compare. See preview for all thats included!
Subjects:
Grades:
6th - 9th
Types:
Also included in: Real Life Math Project Based Learning PBL - Bundle
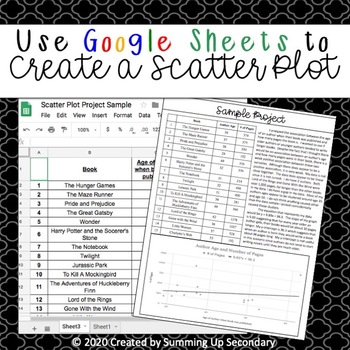
Create a Scatter Plot Using Google Sheets - Distance Learning
Have your students use their computer and Google Sheets to create a scatter plot. Students are asked to pick two variables that interest them, research to obtain at least 15 data points, type their data into Google Sheets and create a Scatter Plot electronically. The program creates the scatter plot for them, will include the trend line, and tell them the equation of the trendline. The students are then responsible for interpreting the graph that was created based on their data and answer the
Subjects:
Grades:
8th - 9th
Types:
Also included in: 8th Grade Pre-Algebra Activities Bundle
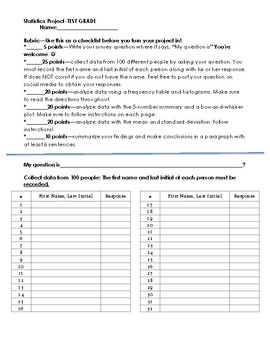
Statistics Project
This is a project has the students come in up with a survey question for 100 people. They then take this data and create a histogram, relative frequency histogram, box plot, and normal curve with follow up questions after each summary of data. They then summarize their findings in a paragraph.
Subjects:
Grades:
9th - 12th
Types:
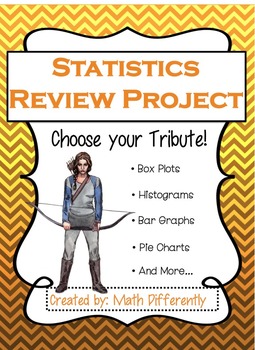
Statistics Review Project
This project is an excellent review of Algebra 1 statistics. I do, however, also give this to my students in Algebra 2 after we review the material. I do this in order to make sure they really understand these concepts before moving on to more advanced statistics.
This activity requires students to use data on the Hunger Game tributes to make a decision on who would win the game (if you did not already know!) Students must create a histogram, box plot and a bar graph or pie chart with the
Subjects:
Grades:
6th - 11th
Types:

Math through Sports - Analytics in Fantasy (Probability, Z-scores, Simulations)
Have students dive into the world of sports analytics, as they explore some of the statistical concepts used by fantasy experts. Students will learn how simulations, z-scores, and compound probability are used in the realm of fantasy sports. Each section contains a brief introduction, practice problems, and an in-depth activity.Simulations (Fantasy Football) - Students will see how simulations are used to predict future success based on past results. They will also learn how to interpret a do
Subjects:
Grades:
9th - 12th
Types:
CCSS:
Showing 1-24 of 252 results


