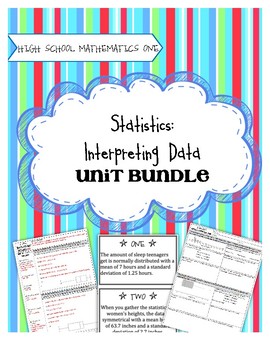
High School Math 1: Statistics and Interpreting Data
RoChelle McGowan
135 Followers
Grade Levels
8th - 10th
Subjects
Resource Type
Standards
CCSSHSS-ID.A.1
CCSSHSS-ID.A.2
CCSSHSS-ID.A.3
Formats Included
- PDF
Pages
87 pages
RoChelle McGowan
135 Followers
What educators are saying
My students enjoyed this material as it was very straightforward and direct. It was easy to teach from and they completed the assignment as they enjoyed it being on a worksheet and not in the book. It was a nice break from our usual exploratory curriculum
Description
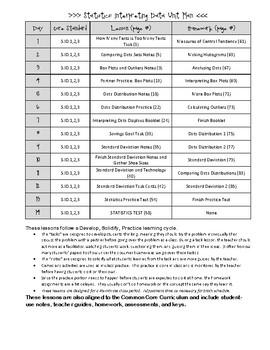
Task-Based Learning gets students intrinsically motivated to learn math! No longer do you need to do a song and dance to get kids interested and excited about learning. The tasks included in this unit, followed by solidifying notes and practice activities, will guarantee that students understand the concepts. This unit covers:
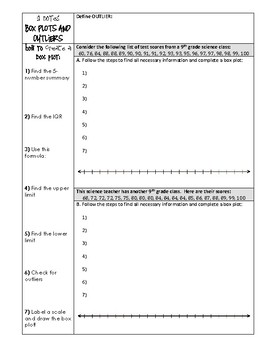
- Displaying one-variable data in a histogram, dot plot, or box plot
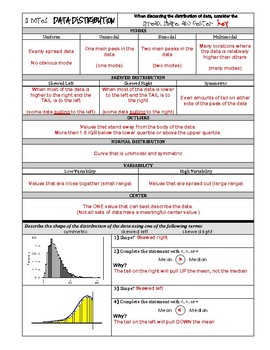
- Describing the distribution of data using statistical vocabulary
- Using data models and statistics vocabulary to compare data sets
- Calculating and interpreting standard deviation
Included in this download:
*All Developing Tasks and Solidifying Notes
*Practice Activities: Instructions and Materials
*Homework and Assessments
*All Keys and Rubrics along with Detailed Teacher Notes
Total Pages
87 pages
Answer Key
Included with rubric
Teaching Duration
3 Weeks
Report this resource to TPT
Reported resources will be reviewed by our team. Report this resource to let us know if this resource violates TPT’s content guidelines.
Standards
to see state-specific standards (only available in the US).
CCSSHSS-ID.A.1
Represent data with plots on the real number line (dot plots, histograms, and box plots).
CCSSHSS-ID.A.2
Use statistics appropriate to the shape of the data distribution to compare center (median, mean) and spread (interquartile range, standard deviation) of two or more different data sets.
CCSSHSS-ID.A.3
Interpret differences in shape, center, and spread in the context of the data sets, accounting for possible effects of extreme data points (outliers).


