Data Analysis and Statistics in Algebra 1 Google Forms Homework and Assessment
Lisa Davenport
6.5k Followers
Grade Levels
6th - 9th
Subjects
Standards
CCSSHSS-ID.A.1
CCSSHSS-ID.A.2
CCSSHSS-ID.A.4
CCSSHSS-ID.B.5
Formats Included
- Google Drive™ folder
Pages
6 assignments
Lisa Davenport
6.5k Followers

Includes Google Apps™
This bundle contains one or more resources with Google apps (e.g. docs, slides, etc.).
What educators are saying
My students really enjoyed doing this activity. They were engaged, and it was really easy to grade. Thank you so much!
Data Analysis & Statistics in Algebra 1 Bundle is an awesome addition to assigning homework and/or using it as an in-class assignment
Products in this Bundle (6)
showing 1-5 of 6 products
Bonus
Algebra 1 Google Forms Unit 13 (Single Download)
Also included in
- This bundle includes all SEMESTER 2 Algebra 1 editable Google Forms homework assignments, quizzes, and tests that I have created. Every assignment also includes a "worksheet" that corresponds with the questions on each form. Just assign digitally or print + go!Not 1:1? Not using Google Classroom,Price $45.00Original Price $85.75Save $40.75
Description
This Algebra 1 Google Forms bundle currently includes auto-grading assignments on the following skills related to data analysis and statistics:
- Measures of Central Tendency
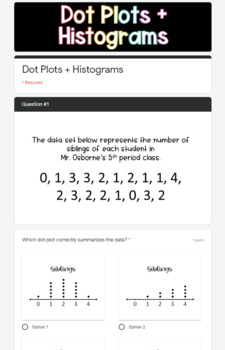
- Dot Plots and Histograms
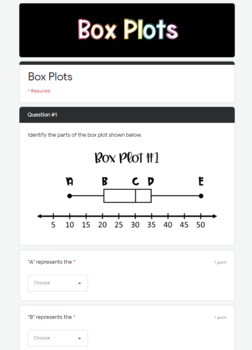
- Box Plots
- Standard Deviation and The Empirical Rule
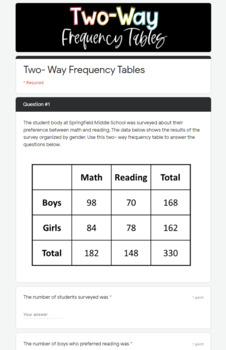
- Two-Way Frequency Tables
- Scatter Plots
Each assignment also includes a PDF "worksheet" for students to complete along with the form.
All of the assignments in this bundle are also included in my:
★ Algebra 1 (Semester 2) Google Forms Bundle
You may also be interested in my:
★ Algebra 1 (Semester 1) Google Forms Bundle
Questions, concerns, or requests? Feel free to email me at:
Total Pages
6 assignments
Answer Key
Included
Teaching Duration
N/A
Report this resource to TPT
Reported resources will be reviewed by our team. Report this resource to let us know if this resource violates TPT’s content guidelines.
Standards
to see state-specific standards (only available in the US).
CCSSHSS-ID.A.1
Represent data with plots on the real number line (dot plots, histograms, and box plots).
CCSSHSS-ID.A.2
Use statistics appropriate to the shape of the data distribution to compare center (median, mean) and spread (interquartile range, standard deviation) of two or more different data sets.
CCSSHSS-ID.A.4
Use the mean and standard deviation of a data set to fit it to a normal distribution and to estimate population percentages. Recognize that there are data sets for which such a procedure is not appropriate. Use calculators, spreadsheets, and tables to estimate areas under the normal curve.
CCSSHSS-ID.B.5
Summarize categorical data for two categories in two-way frequency tables. Interpret relative frequencies in the context of the data (including joint, marginal, and conditional relative frequencies). Recognize possible associations and trends in the data.


