405 results
High school statistics lesson pdfs
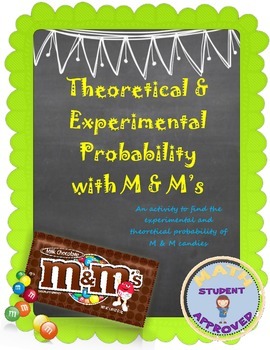
Theoretical and Experimental Probability M&M activity
Students need to find the probability of picking certain colored M&Ms, and asked to change them into decimals, fractions, and percents. They are asked to draw specific M&Ms at random for experimental probability problems. They are asked to make a few predictions, as well. This is a lengthy lesson and takes a while to get through, so make sure you have enough time to get through it. It can be done in 2 days, and if you need to use colored chips or counters instead, go for it!
Subjects:
Grades:
5th - 11th
Types:
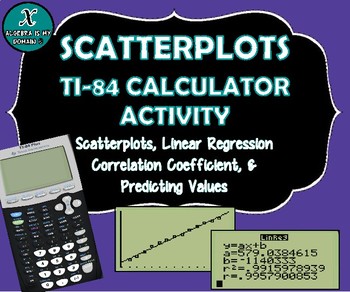
TI-84 CALCULATOR ACTIVITY - Data, Scatterplots, Regression & Line of Best Fit
This file includes four linear regression examples (all real-life data). The examples cover the following topics for the TI-84 graphing calculator:
* Creating a scatterplot
* Performing linear regression (finding the equation of the best-fit line)
* Interpreting the slope of the equation
* Calculating and interpreting the correlation coefficient
* Predicting values (using the linear regression equation)
The first example gives the step-by-step instructions to calculate all the necessary value
Subjects:
Grades:
7th - 12th, Higher Education
Types:
CCSS:
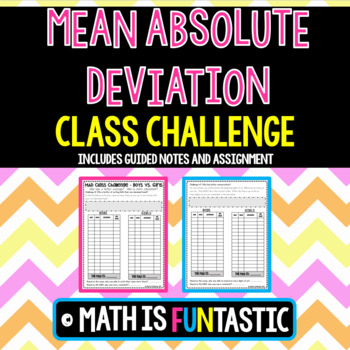
Mean Absolute Deviation - Class Challenge
Are you looking for an engaging way to teach Mean Absolute Deviation? Look no further! My students love completing this lesson.
This product is designed to help your students master the MAD in three easy steps.
1) Guided Notes – The guided notes contain an introduction to calculating MAD. Students will write the overall meaning of the MAD and the steps to calculating. There is an example problem for the teacher to model and then two “you try” problems for students to try independently a
Subjects:
Grades:
6th - 9th
Types:
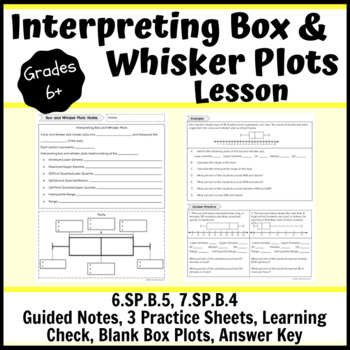
Interpreting Box and Whisker Plots Lesson- Notes, Practice, Learning Check
This interpreting box and whisker plots lesson consists of a guided notes sheet, 3 practice sheets, a learning check, 2 different half sheets of blank box plots and an answer key. You can hole punch the note pages and have students place them in their binders or a 3-prong folder. There are teacher notes to guide you through the direct instruction with students. There are three pages of practice. One page can be used as independent practice when students are ready; this could be in class or homew
Subjects:
Grades:
6th - 10th
Types:
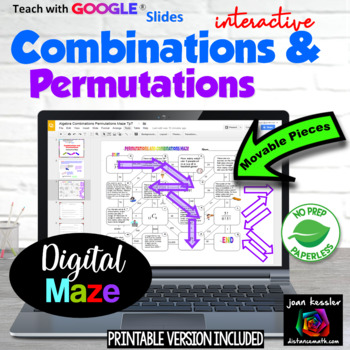
Permutations and Combinations Digital Maze + HW and Printable version
This Combinations, Permutations, and Counting Fun Maze is engaging, challenging, and fun for your students. This resource includes both a digital and printable version. This activity reinforces the concepts of permutations, combinations, and counting principles and is great practice. The different types of problems are placed randomly in the maze so that students must first decide the type of question before solving. The questions on the maze are letter coded so that if a student has a questi
Subjects:
Grades:
8th - 11th
Types:
CCSS:
Also included in: Algebra 2 Digital MEGA Bundle plus Printables
High School Math 1: Statistics and Interpreting Data
Task-Based Learning gets students intrinsically motivated to learn math! No longer do you need to do a song and dance to get kids interested and excited about learning. The tasks included in this unit, followed by solidifying notes and practice activities, will guarantee that students understand the concepts. This unit covers:
- Displaying one-variable data in a histogram, dot plot, or box plot
- Describing the distribution of data using statistical vocabulary
- Using data models and stati
Subjects:
Grades:
8th - 10th
Types:
CCSS:
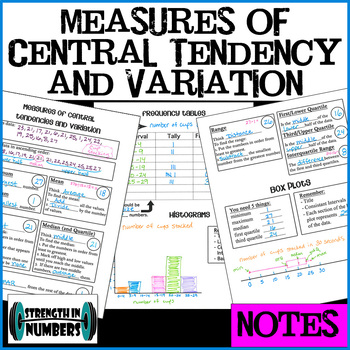
Interactive Notebook NOTES: Mean Median Mode Range Quartiles Box Plot Histogram
This set contains suggestions for student data collection and notes that use the data for measures of central tendencies and variation (mean, median, mode, range, first and third, quartiles, interquartile range, outliers), box plots, frequency tables, and histograms! Sounds like so much but these topics all go together so well. And by using data collected by students ABOUT students, they will be much more interested. This product contains ideas for collecting data, three full size (8.5x11) pa
Subjects:
Grades:
6th - 9th
Also included in: Complete BUNDLE of 50 Foldable Notes for Math 7
Grade 8 Ontario Math Probability Digital Google Slides + Form
Do you need a practical and engaging resource for the NEW Ontario Math Number strand? Are you planning for the NEW Grade 8 Ontario Math Curriculum? This editable Google Slide resource is what you need! This resource is for the Grade 8 DATA strand and covers specific expectations for “D2 Probability". In this resource, students will experience math through engaging real-life questions, storytelling through math, and interactive slides. What’s Included2 Google Slide presentations67 UNIQUE and ED
Subjects:
Grades:
7th - 9th
Types:
Also included in: Grade 8 NEW Ontario Math Curriculum Full Year Digital Slides Bundle
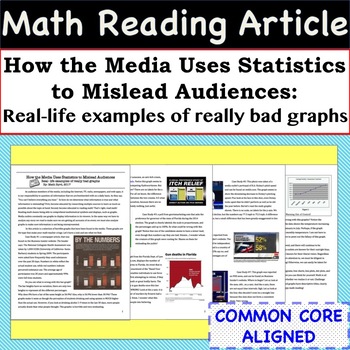
Statistics Math Article - Case Studies of Bad Graphs found in the Media
Incorporate Reading & Writing into the Math Classroom with this article and accompanying worksheet! The 4 page article is entitled - "How the Media Uses Statistics to Mislead Audiences: Real- life examples of really bad graphs". The worksheet helps students summarize the case studies and the article as a whole. This resource can be used in so many ways, some ideas are: station activity, independent reading assignment, small group activity, homework assignment, or whole class discussion.Skill
Subjects:
Grades:
8th - 11th
CCSS:
Also included in: Common Core Algebra 1 MATH READING ARTICLES - BUNDLE PRICE!
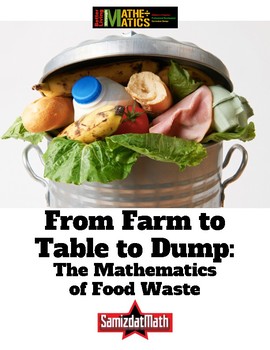
Food Waste and Mathematics: From Farm to Table to Dump
Here's a very uncomfortable fact: it takes 4 pounds of potatoes to make 1 pound of potato chips. That means that for every 1 pound bag of potato chips you eat, 3 pounds of potatoes have to be thrown away. What a waste of food! This is a series of activities that looks at the hidden world of food waste. It includes a look at how much food is wasted as it is "processed" into finished products like french fries and potato chips. It also includes mathematical activities where students calculate how
Subjects:
Grades:
5th - 12th, Adult Education
Types:
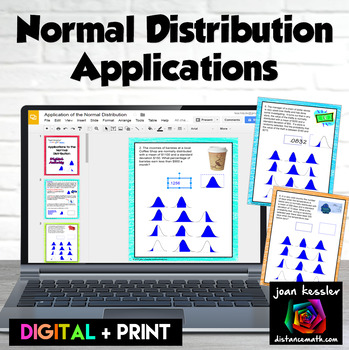
Normal Distribution Applications Digital Activity plus Print
In this digital interactive activity for Applications of the Normal Distribution your students will solve 10 real world applications of the Normal Distribution with GOOGLE® Slides. They will first analyze the problem, then “sketch” the scenario by selecting one of 12 shaded normal distribution diagrams, and then determine the solution either using technology or manually by tables using z-scores.A printable version of the questions is also included. Students will also read, analyze and sketch
Subjects:
Grades:
9th - 12th
Types:
CCSS:
Also included in: Probability and Statistics Algebra 2 Unit 11 Activity Bundle
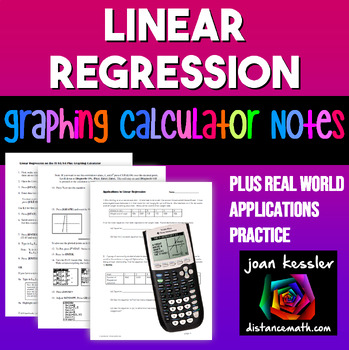
Linear Regression | TI-84 Graphing Calculator plus Applications
This clear, concise, step by step notes help your students use the TI 83 and TI 84 Graphing Calculator to enter data into lists, create a linear regression equation and to plot the equation along with the data simultaneously. Also included is a 3 page worksheet with five real world examples for students to practice. Solutions included. These can be used as Binder Notes or printed smaller for Interactive Notebooks._________________________________________________Related Products★ Quadratic Re
Subjects:
Grades:
9th - 11th, Higher Education
Types:
CCSS:
Also included in: Linear Functions and Systems Algebra 2 Unit 2 Activity Bundle
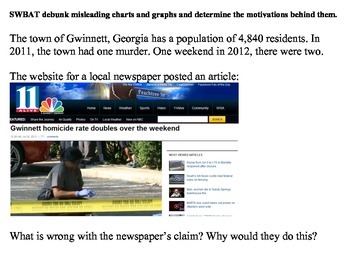
Misleading Charts and Graphs (Statistics)
Teaching students to deduce information provided in charts and graphs is an essential part of any math curriculum.
However, what do you do when the graph itself provides misleading or false information?
This lesson is a good way to get students to look critically at graphically displayed data and see through those who try to manipulate data for their own purposes.
Subjects:
Grades:
7th - 12th, Higher Education, Adult Education
Types:
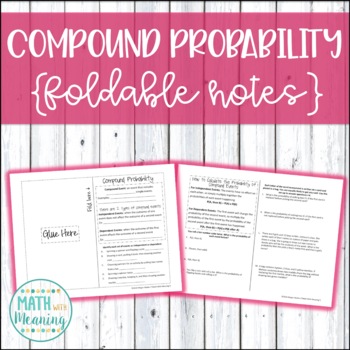
Compound Probability Foldable Notes Booklet - Aligned to CCSS 7.SP.C.8
These foldable notes are perfect for an interactive math notebook! In these notes, students will learn to whether compound events are independent or dependent and how to calculate the probability of compound events. Please view the preview file to determine if this product is appropriate for your students!An answer key is included.This activity is aligned to CCSS 7.SP.C.8.Please note that this activity is NOT editable. The text, problems, and images are not able to be changed.**Save money by buy
Subjects:
Grades:
6th - 9th
CCSS:
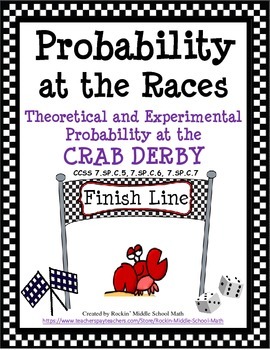
Probability-Theoretical and Experimental-Crab Derby Race CCSS 7.SP.C.5, 6, and 7
This is a fun, engaging 3 part activity including lesson plan that will have your kids so engaged they will forget they are actually learning math. Students will first work in groups/partners and simulate a crab derby race in a game using the sum of two dice to see whose crab will cross the finish line first. Then, they will complete a matrix of possible outcomes when two dice are tossed and added together to get particular sums. They will answer questions that apply to both theoretical and e
Subjects:
Grades:
5th - 9th
Types:
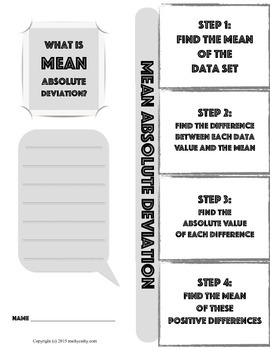
Mean Absolute Deviation Foldable Note-Taking Guide
This foldable will help make the process of learning how to calculate the mean absolute deviation of a data set easier to digest! In the new Texas TEKs, 8th grade students must be able to calculate the MAD of a small data set.
This foldable note-taking guide helps students take this process one step at a time. I encourage students to reference this structured example as they work more complex problems, and analyze the MAD of multiple data sets. This foldable guide is designed to get them s
Subjects:
Grades:
6th - 9th
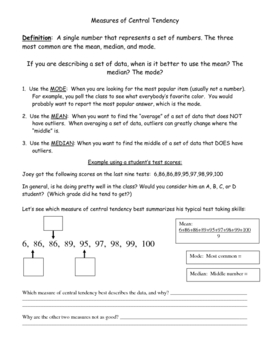
Measures of Central Tendency: When to use mean, median, or mode
Students can quickly learn how to find the mean, median, mode, or range of a set of data, but they have a harder time understanding when to use them. When is median better than mean? Mode better than median? This worksheet helps explain the different measures of central tendency.
Subjects:
Grades:
5th - 10th
Types:
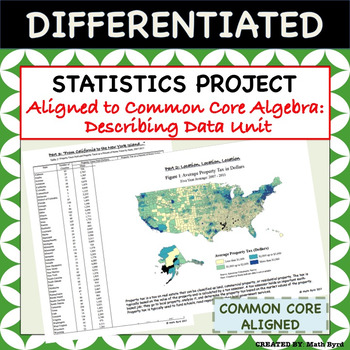
Statistics Project - Aligned to Common Core Algebra - Describing Data Unit
This differentiated U.S. Home Energy & Tax Themed Statistics Project covers all of the "describing data" standards of the Common Core Algebra Course using real data! Students will analyze various forms of tables & graphics to make inferences and interpret the data. The project is perfect for use as a summative assessment since students are required to justify their findings in open-ended format. Allow students to work in pairs, small groups, or individually! A grading rubric and selected
Subjects:
Grades:
8th - 11th
Types:
CCSS:
Also included in: Common Core Algebra 1 PROJECTS - BUNDLE PRICE!
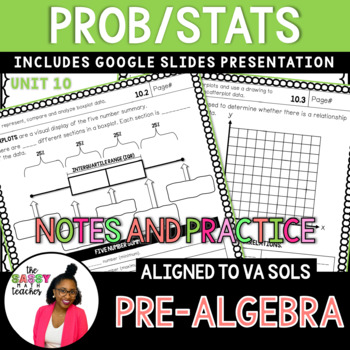
8th Grade Statistics and Probability Notes - 2016 Va Math SOLs
This 8th Grade Statistics and Probability Notes bundle is a great way to introduce your students to compound probability, boxplots and scatterplots.⭐️⭐️Full Year of 8th Grade Math Guided Notes⭐️⭐️⭐️⭐️⭐️FREE 8th Grade Math Pacing Guide⭐️⭐️⭐️Your 8th-graders will learn to distinguish between independent and dependent events along with interpreting and creating boxplots and scatterplots.The notes are perfect for binders!PLUS: At the top of each page, you will find the learning objective and space f
Subjects:
Grades:
7th - 9th
Types:
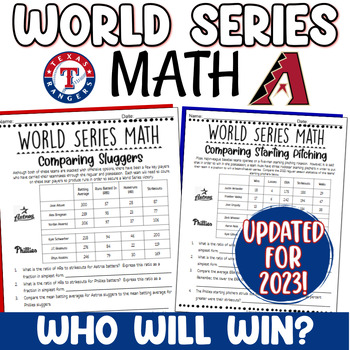
World Series Math 2023 Activity Real-World MLB Baseball Project PBL
This engaging World Series Math Activity compares the 2023 World Series teams using real-world statistics and is a perfect fall activity for your middle or high school classroom!Students explore the 2023 seasons of the Arizona Diamondbacks and Texas Rangers, comparing starting pitching, closers, prominent sluggers, fielding percentages, and postseason performances. After analyzing these statistics, students will be asked to award advantage to one team for each of these categories. Ultimately,
Subjects:
Grades:
6th - 9th
Finding the Standard Deviation of a set of numbers
Students learn the formula for standard deviation. This package consists of the following:1. Students are given different sets of numbers. They find the mean, variance, and standard deviation of each set. There is a fully-explained example followed by 8 problems.2. Students then compare the consistency of runners and football teams in the second activity. They are taught what the spread of data actually means. Along the way, students can use a template created to help with the computations. Of c
Subjects:
Grades:
8th - 11th
Types:
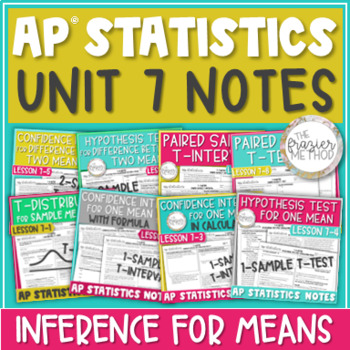
AP Statistics Notes Unit 7 Confidence Intervals & Hypothesis Tests for Means
8 AP® Statistics Notes on CONFIDENCE INTERVALS & HYPOTHESIS TESTS FOR SAMPLE MEANS. Through definitions, examples, and AP Stats FRQs, these notes teach through T-Distribution / T-Model, 1-Sample T-Interval, 1-Sample T-Test, 2-Sample T-Interval, 2-Sample T-Test, Paired Sample T-Interval, and Paired Sample T-Test. Each confidence interval and hypothesis test is taught by-hand with its formula and with its TI-84 Plus CE Calculator function. You can also use this bundle for AP® Statistics Exam p
Subjects:
Grades:
10th - 12th
Types:
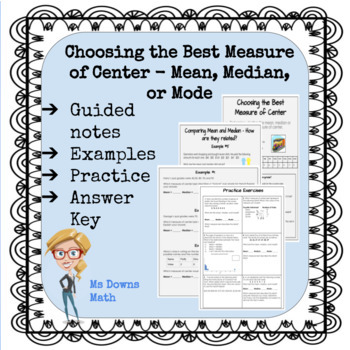
Choosing the Best Measure of Center - Mean, Median or Mode
This lesson is about how to choose which measure of center is best - Mean, Median, or Mode. I use this lesson in my Introduction to Statistics high school course.The guided lesson shows examples with skewed data and without. There is a practice (homework) assignment with 6 questions.An answer key to the entire lesson is provided as well.
Subjects:
Grades:
8th - 12th
Types:
Interpreting Graphs for the Middle & Junior High School: Book 2
Here is another set of data graphics for your students to analyze and interpret. Using survey results from the USA Today newspaper, students will be asked to explain what the graphics are illustrating. Each activity will ask the student to identify basic information presented in each graphic and make some projections based on the data given in the survey.
The activities in this packet are a great way to improve your student’s skills in taking apart graphic displays of information. Brin
Subjects:
Grades:
4th - 10th, Adult Education
Types:
Showing 1-24 of 405 results


