15 results
High school statistics rubric pdfs
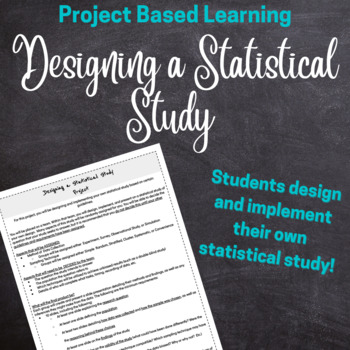
Statistics Project Design and Implement a Statistical Research Study Project
Prove that your students know how a good statistical or research study is designed! In this project, students will be assigned a method of data collection (either Observational Study, Experiment, Survey, or Simulation) and a sampling technique (either cluster, stratified, simple random, systemic, or convenience) and will design their own research question and study. The goal is for students to develop a research question that works well with the method of collection and sampling technique they w
Subjects:
Grades:
11th - 12th, Higher Education, Adult Education
Types:
Project. Misleading Graphs Analysis Write Up with Rubric
Students will watch the TEDTalk How to spot a misleading graph - Lea Gaslowitz then do some research to find misleading graphs in the media!Objective. Students will research TWO misleading graphs, then create a google doc with those graphs and provide a written analysis. This is an individual assignment. Opportunity to explain...- Cherry Picking- Vertical axis manipulation- Horiztonal axis proportion- the author's motivation to graphically manipulate dataRubric is provided.
Subjects:
Grades:
8th - 12th
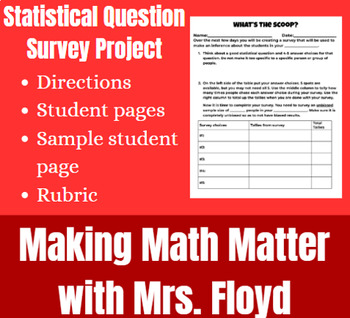
Statistical Question Survey Project
Students will be creating their own statistical questions to survey students in their grade (or school if you have a small school), the sample, and make an inference about all of the students in their grade(or school), the population. This would be great to either go along with the unit, right after, or at the end of the year for a review project. See the preview of what a project could look like for a student.Page with description, materials needed, and directionsStudent pagesSample student pag
Subjects:
Grades:
6th - 10th
Types:
Also included in: Statistics Activities Bundle

Probability for grades 6-10
This packet will guide you into putting on a school wide carnival with games of chance. I have been doing this for 15 years and it is always a success. The Rubric for the final project is included along with experiments.
Subjects:
Grades:
6th - 10th
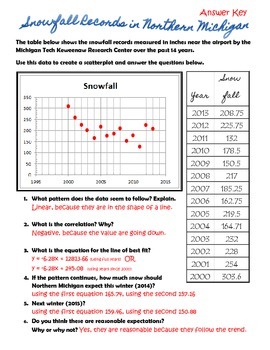
Scatter Plot Prediction Worksheet Answer Key
This is the answer key to my free download!
Subjects:
Grades:
9th - 12th
Types:
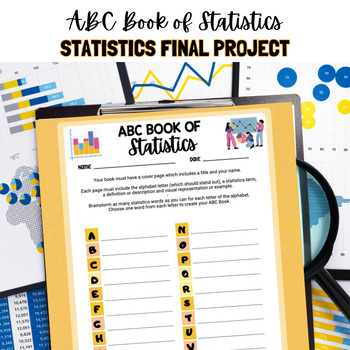
ABC Book of Statistics
Looking for a Cumulative Project for Your Statistics Class?This ABC Book gives students an opportunity to search and review statistics terminology from throughout the course. Students use the brainstorm sheet to write down statistics vocabulary words for each letter of the alphabet. Students will then create an ABC book. A sample page is provided (Z is for Z-Score!) A 15 point rubric is also included for this Statistics Project!
Subjects:
Grades:
9th - 12th
Types:
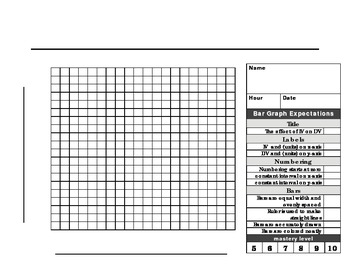
Bar Graph paper and rubric
This 20 X 20 graph paper with rubric is made for a beginner scientist to make a the perfect BAR graph. The checklist format makes it easy for students to know what is expected when graphing. Enjoy!
Subjects:
Grades:
1st - 12th, Higher Education, Adult Education
Types:
Math Project Scatter Plots: Are You Really Going to Eat That? *DISTANCE LEARNING
PRINT and DIGITAL * * Makes distance planning so much easier!Math Project Scatter Plots: Are You Really Going to Eat That? This math project is a fun way for your students to use bivariate data that is highly engaging and relevant to them to construct scatter plots in a real-world situation! Your students will enjoy making choices about restaurants and meals they like to eat based on their personal needs and wishes. Students will organize the nutrition data of the meals they choose using tables
Subjects:
Grades:
7th - 10th, Adult Education
CCSS:
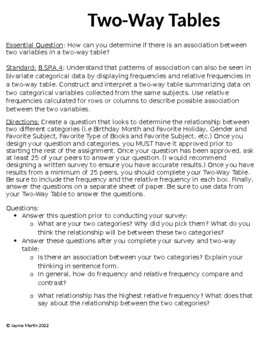
Two-Way Tables
Students will use their knowledge of two-way tables to find a real-world scenario where they can apply their knowledge and display it in a two-way table. Students are able to investigate a question of interest and display their findings. Great for review or assessment.
Subjects:
Grades:
7th - 9th
Types:
CCSS:

School Wide Carinval at Your Fingertips
This packet will guide you into putting on a school wide carnival with games of chance. I have been doing this for 15 years and it is always a success. The Rubric for the final project is included along with experiments.
Subjects:
Grades:
6th - 10th
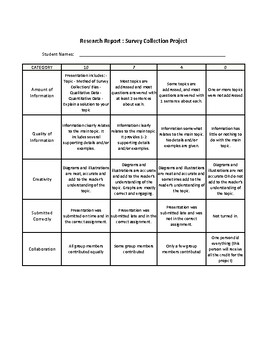
Survey Project - Rubric for Presentation
Rubric to coincide with the presentation. I uploaded this to Canvas and graded on there.
Subjects:
Grades:
9th - 12th
Types:
Also included in: Survey Project
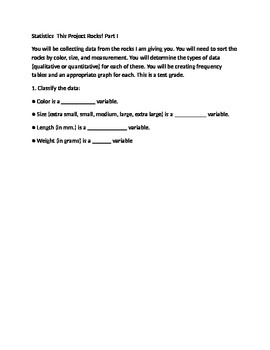
This Project Rocks!
This project is focuses on classifying data and creating tally tables, frequency distributions, and appropriate graphs. Included in this file: directions, tables, and a grading rubric. Students collect data, therefore, no answer key is available.
You will be collecting data from the rocks I am giving you. You will need to sort the rocks by color, size, and measurement. You will determine the types of data (qualitative or quantitative) for each of these. You will be creating frequency tables
Subjects:
Grades:
11th - 12th
CCSS:
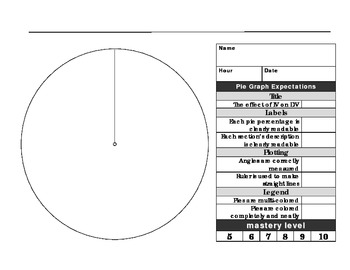
Pie Graph Paper and Rubric
This pie graph paper with rubric is made for a beginner scientist to make a the perfect PIE graph. The checklist format makes it easy for students to know what is expected when graphing. Enjoy!
Subjects:
Grades:
3rd - 12th, Higher Education
Types:
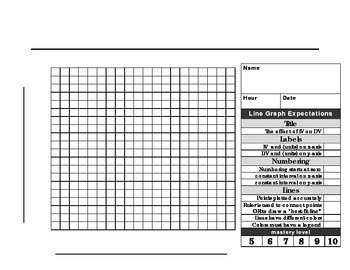
Line graph paper with rubric
This 20 X 20 graph paper with rubric is made for a beginner scientist to make a the perfect LINE graph. The checklist format makes it easy for students to know what is expected when graphing. Enjoy!
Subjects:
Grades:
3rd - 12th, Higher Education
Types:
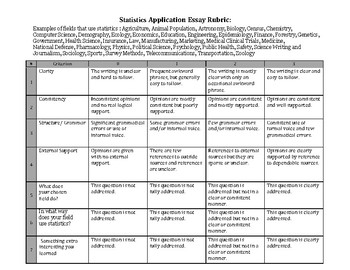
Uses of Statistics Essay
Students often learn statistics without any concept of why certain statistical methods were formulated, and how they are applied in different fields. I use this essay as the introduction to statistics - before anything is taught, so that while they are learning they have prior information to pull from, and a context for studying.I make this a two page paper - the first page explains what the field does, using citation, and the second page writes about how the field uses statistics - also using c
Subjects:
Grades:
10th - 12th
CCSS:
Showing 1-15 of 15 results


