164 results
High school statistics poster pdfs
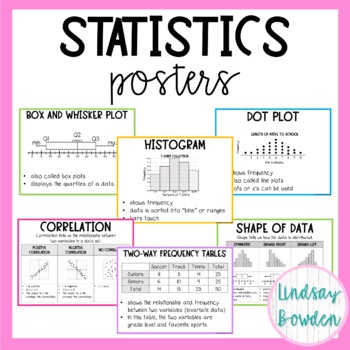
Statistics Posters (Algebra 1 Word Wall)
These statistics posters come with 18 posters on letter paper (8.5" by 11"). They are meant to be printed in color, but you can also print them in black and white.Posters include:box and whisker plots, histograms, stem and leaf, dot, plot, range, interquartile range, measures of central tendency, mean absolute deviation, shape of data, peaks in data, spread of data, scatter plots, correlation, causation vs. correlation, line of best fit, two-way frequency tables, standard deviation, normal dist
Subjects:
Grades:
8th - 10th
Also included in: Statistics Unit Bundle
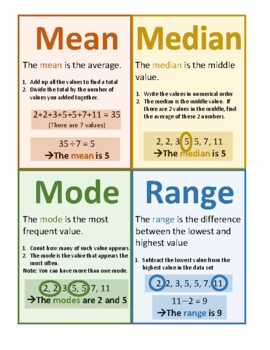
Mean Median Mode Range Poster Notes Anchor Chart
The PDF poster describes mean, median, mode, and range in an easy-to-understand and visual way. Enjoy!Check out my other posters here:STEM: Women in STEM Insp. Quotes, Women in STEM, Careers, Heroes Timeline, Inspirational Quotes from STEM HeroesABCs of Math: STEM Innovations, Amazing STEM facts, Careers, Shapes, in Nature Modern Style, in Nature Vintage Style, in Everyday LifeMath Vocabulary Alphabet: Elementary, Middle School, High SchoolMath in Art: Set A, Set B, Big BundleMath Modelling: Se
Subjects:
Grades:
5th - 9th
Types:
Finding Mean, Median, Mode, and Range
Simple worksheets (5 problems each) to introduce and practice finding the mean, median, mode, and range of a data set. Have students complete with or without calculator, depending on their instructional level. Product includes:-Reference posters for mean, median, mode, and range. Each poster includes the measures' definitions and directions for how to find them with an example.-5 worksheets about finding the mean.-5 worksheets about finding the median.-5 worksheets about finding the mode.-5 work
Subjects:
Grades:
1st - 12th
Types:
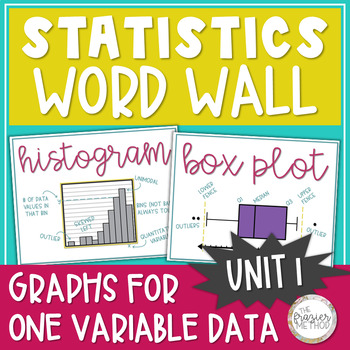
Statistics Word Wall Posters - Histogram, Box Plot, Bar Graph, Dot Plot Unit 1
Use these Statistics Posters to add high school math classroom decor to your bulletin board, hallway, math word wall, or classroom door with these great 8.5" by 11" Statistics Word Wall pages filled with statistics vocabulary, formulas, and graphs! All graphs are from Unit 1: Exploring One-Variable Data in AP Statistics, and the information on each slide aligns with AP College Board's objectives and standards for AP Statistics. ALL PAGES ARE IN COLOR & GRAYSCALE.Size: 8.5 by 11 inches[If you
Subjects:
Grades:
10th - 12th
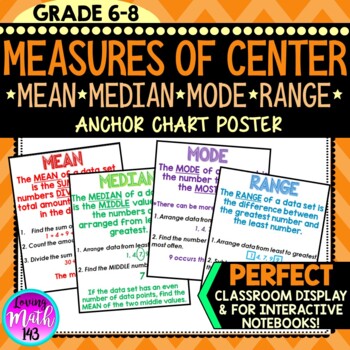
Mean, Median, Mode, Range Anchor Chart Poster
This middle school math anchor chart poster is a great tool to display in your classroom or distribute to your students to place in their interactive notebooks and/or binder. This anchor chart is great break down of mean, median, mode, and range. This anchor is aligned with the 6th and 7th grade Common Core standards students. GET THIS ANCHOR CHART BY PURCHASING MY MATH ANCHOR CHART BUNDLE! CHECK IT OUT HERE!***************************************************************************************
Subjects:
Grades:
6th - 10th
CCSS:
Also included in: 6th Grade Math Anchor Posters for the whole Year! {BUNDLE!}
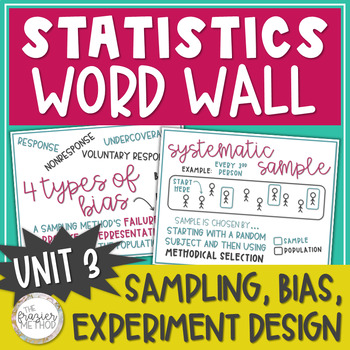
Statistics Word Wall Posters Sampling Methods, Bias, Experiment Design AP Unit 3
Use these Statistics Posters to add high school math classroom decor to your bulletin board, hallway, math word wall, or classroom door with these great 8.5" by 11" Statistics Word Wall pages of SAMPLING METHODS, TYPES OF BIAS, & EXPERIMENTAL DESIGN vocabulary! Put them up one at a time as you teach through each term or display them all at once. 34 PAGESALL PAGES ARE IN COLOR & GRAYSCALE.SIZE: 8.5 x 11 inches All vocabulary terms are from Unit 3: Collecting Data in AP Statistics, and the
Subjects:
Grades:
10th - 12th
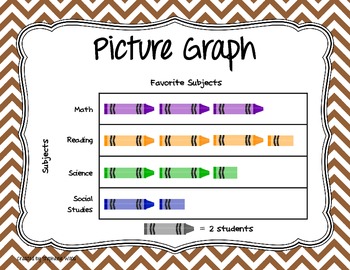
Types of Graphs Posters
Posters showing the various types of graphs for data display.
Includes:
Line Plot/Dot Plot
Line Graph
Bar Graph (Horizontal and Vertical)
Stem & Leaf Plot
Histogram
Box & Whisker Plot/Box Plot
Frequency Table
Circle Graph
Pictograph
Subjects:
Grades:
K - 12th, Higher Education, Adult Education
Types:
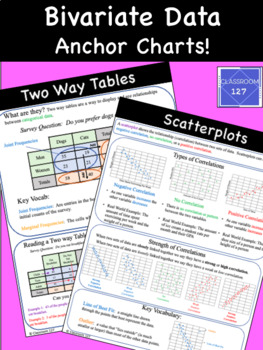
Bivariate Data Anchor Charts
This resource contains two different anchor charts to help students learn about bivariate data.To be more specific, the anchor charts help students to master the concepts of scatterplotstwo way tablesThis product also includes directions on how you can enlarge these anchor charts for free! Having the ability to see these charts from anywhere in the room has, in particular, really helped my ELL and SPED students master these challenging concepts.Possible uses for this product includeenlarge and u
Subjects:
Grades:
7th - 9th
Also included in: Anchor Charts Bundle
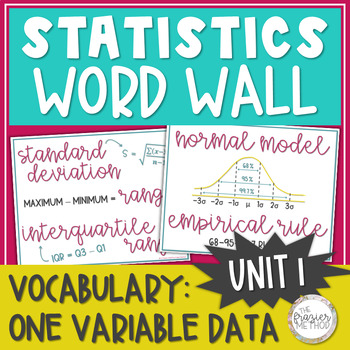
Statistics Word Wall Posters - Normal Model, Median, Mean, Skew, Z-Score Unit 1
Add some high school math classroom decor to your room or hallway with these great 8.5" by 11" statistics posters filled with statistics vocabulary, formulas, and graphs! These pages of AP Statistics decor can be displayed on any math word wall or math bulletin board! All vocabulary, formulas, and graphs are from Unit 1: Exploring One-Variable Data in AP Statistics, and the information on each slide aligns with AP College Board's objectives and standards for AP Statistics. ALL PAGES ARE IN COLOR
Subjects:
Grades:
10th - 12th
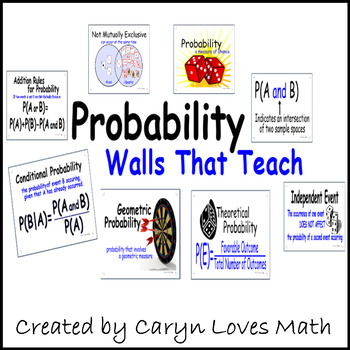
PROBABILITY- Vocabulary and Formulas Poster-Walls That Teach
25 Probability Walls that Teacher/Posters/Word Walls/ Vocabulary Words
25 8.5in by 10 in printable pages for your walls
Some of the words
-Probability
-Adding Probabilities
-AND
-OR
-Geometric Probability
-Mutually Exclusive
-
View the preview to see all the pages
Subjects:
Grades:
7th - 12th
Types:
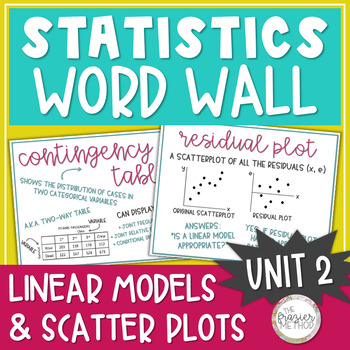
Statistics Word Wall Posters - Scatter Plot, Linear Model, Residual, Correlation
Use these Statistics Posters to add high school math classroom decor to your bulletin board, hallway, math word wall, or classroom door with these great 8.5" by 11" Statistics Word Wall pages filled with statistics vocabulary, formulas, and graphs! \Put them up one at a time as you teach through each term or display them all at once. All vocabulary, formulas, and graphs are from Unit 2: Exploring Two-Variable Data in AP Statistics, and the information on each slide aligns with AP College Board'
Subjects:
Grades:
10th - 12th, Higher Education
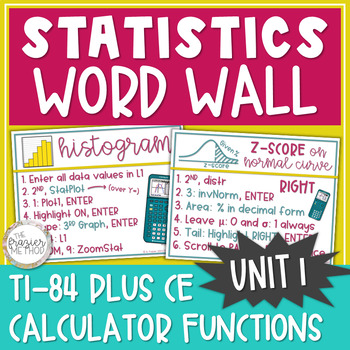
Statistics Word Wall Posters TI 84 Plus CE Calculator Box Plot Histogram Z-Score
Add high school math classroom decorations to your classroom bulletin board, hallway bulletin board, math word wall, or classroom door with these great 8.5" by 11" statistics posters filled with TI-84 CE CALCULATOR FUNCTIONS, such as graphing a histogram and boxplot, 5-Number Summary, area % under the Normal Model, and z-scores! All calculator functions are from Unit 1: Exploring One-Variable Data in AP Statistics, and the information on each slide aligns with AP College Board's objectives and s
Subjects:
Grades:
10th - 12th
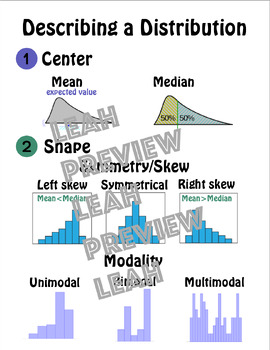
AP Statistics Word Wall Posters - Printer Friendly
Statistics can be overwhelming with all of the terminology and specifics. Make it easier for your students to understand with these colorful visuals, tailored to the AP Statistics curriculum. Included are 15 posters with the following concepts: describing a distribution (center; shape; variability - range, standard deviation, interquartile range; unusual features), population vs sample, parameter, statistic, standardized/z-score, normal distribution, empirical rule, standard normal table, least
Subjects:
Grades:
9th - 12th, Higher Education
Types:
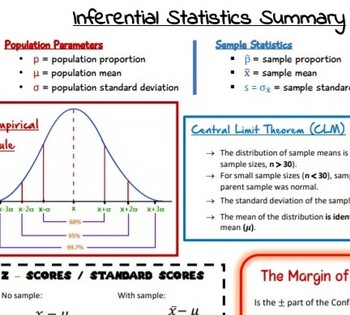
Inferential Statistics Summary
Included: complete PDFA summary of the notation and formulas for Higher Level Leaving Certificate Inferential Statistics:Empirical RuleCentral Limit TheoremZ / Standard ScoresMargin of ErrorConfidence IntervalHypothesis TestP Value
Subjects:
Grades:
11th - 12th, Higher Education
Types:
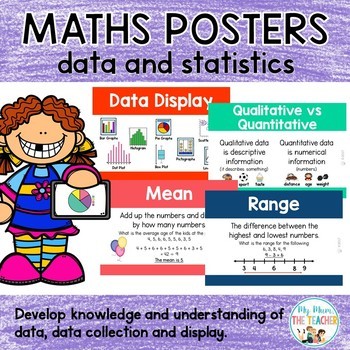
Data Analysis and Statistics Classroom Posters
This set of no-prep, printable Data & Statistics classroom posters, that include definitions & examples of Mean, Mode, Median & Range, will help students remember and understand what data is, how is can be collected and the different ways of displaying results. There are 10 posters:- What is Data?- Primary and Secondary Data- Data Display- Qualitative vs Quantatative- Discrete or Continuous- Census or Sample- Mean- Median- Mode- RangeHOW CAN YOU USE THIS PRODUCT?Print these off in A4
Subjects:
Grades:
6th - 10th
Types:
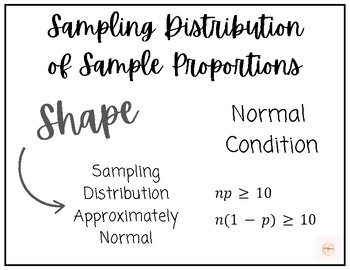
AP Statistics Unit 5 Word Wall Posters
AP Statistics Unit 5 Word Wall Posters
Subjects:
Grades:
11th - 12th
Types:
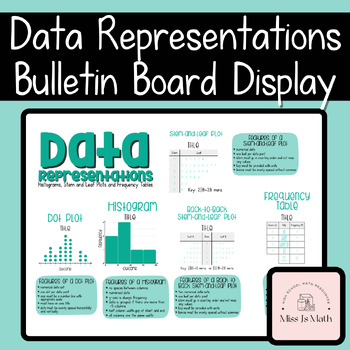
Data Representations Bulletin Board Wall Display - Graphs, Histograms, Stem&Leaf
This Data Representations Bulletin Board Wall Display includes a large selection of data displays and graphs along with their properties to simply print, cut and laminate. Elements are provided separately and in two different colours to allow for easy printing and co-construction with your class.Preview shows different elements provided.Display includes:Frequency tableDot plotHistogramStem and leaf plotBack to back stem and leaf plot
Subjects:
Grades:
7th - 10th
Central Tendency Poster - Worksheet & Answer Key Included!
A poster that defines central tendency concepts and includes examples for each. Definitions include mean, median, mode, and range. There is also an introductory worksheet along with an answer key to help learners practice and apply the definitions!
Subjects:
Grades:
6th - 9th
Types:
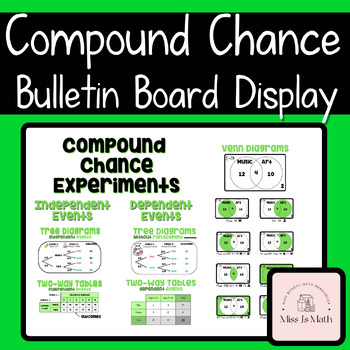
Compound Probability (Two Step Chance) Bulletin Board Wall Display
This Compound Probability (Two Step Chance) Bulletin Board Wall Display includes a range of displays for independent and dependent events, each supplied separately to simply print, cut and laminate.Display includes:Compound Chance Experiments titleIndependent Events titleDependent Events titleVenn Diagrams titleTree diagrams (dependent and independent)Two way tables (sample space and dependent events)Venn diagrams showing "and", "or" and complementary events
Subjects:
Grades:
7th - 12th
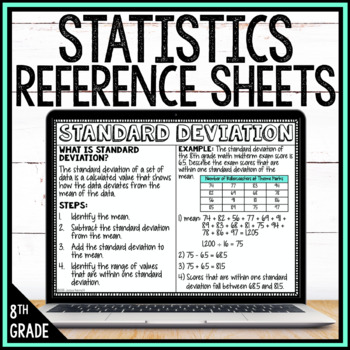
8th Grade Math Anchor Chart Reference Sheets
This resource is an excellent tool for home or distance learning. It comes in both PDF form for printing or Google Slides™ for students to receive digitally. There are a total of 13 student-friendly, anchor chart reference sheets aligned to The Statistics and Probability Domain of 8th-grade math! Each chart includes information about the topic, steps to solve, and an example. This resource is excellent for enhancing classroom instruction, aiding in individual or group work, and offers a "go-to"
Subjects:
Grades:
7th - 9th
Also included in: 8th Grade Math Anchor Chart Reference Sheets Posters
Algebra Statistics- Crime Rate Project -Histogram, Trend Line, Box and Whisker
Looking for a Statistics Project? This is one is for you. The student have to search for Crime Rates and use different colored paper to display information on a poster board.
They have to make a scatter plot, draw a trend line, make a histogram, and make a box and whisker.
Subjects:
Grades:
7th - 10th
Types:
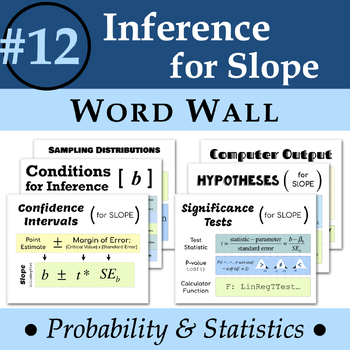
Statistics Word Wall #12: Inference for Slope
Statistics Word Wall #12: Inference for SlopeHelp your statistics students remember essential concepts and vocabulary with a visual word wall! Included are 6 letter-sized thematic posters that encompass over 12 terms! These terms align with Chapter 12 of TPS. TERMSSampling distributions of slope10% conditionNormality conditionConditions for inferenceConfidence intervals for slopeNull & alternative hypotheses for slopeSignificance tests for slopeTest statistic for slopeStandard error for slop
Subjects:
Grades:
9th - 12th
Also included in: Statistic Word Wall BUNDLE
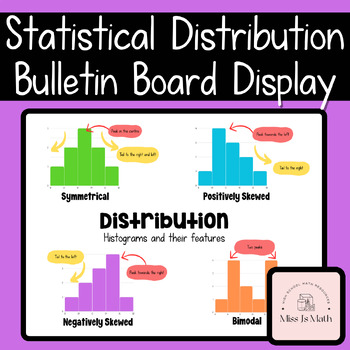
Statistical Distribution Bulletin Board Wall Display - Histograms & skewness
This Statistical Distribution Bulletin Board Wall Display includes properties of statistical distributions to simply print, cut and laminate. Elements are provided both as combined images and separately to allow for easy printing and co-construction with your class.Preview shows different elements provided.Display includes a symmetrical histogram, along with positively and negatively skewed graphs and a bimodal histogram. Arrows are included with explanations to show the peak/s and tail/s of the
Subjects:
Grades:
8th - 10th
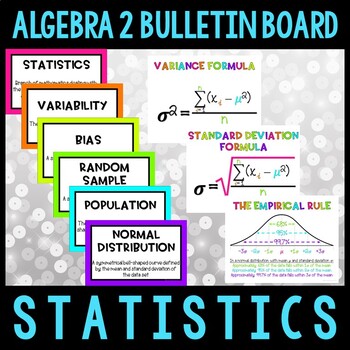
Statistics Algebra 2 Bulletin Board
Create a fun, instructional display in your high school classroom using this Statistics Bulletin Board for common core algebra 2! Download includes 8.5 x 11 inch pdf posters in both color and black & white for printing on color paper. Bulletin boards can work in high school classrooms too! This bulletin board idea can help your students review and recall concepts they need to know.What's included:Vocabulary (words print two per page): statistics, variability, bias, random sample, populat
Subjects:
Grades:
11th
CCSS:
Also included in: Algebra 2 Bulletin Board Bundle
Showing 1-24 of 164 results


