33 results
Free high school graphing laboratories
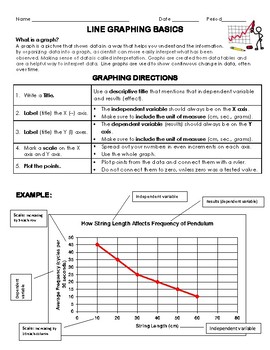
Line Graphing Basics- step by step directions; resource sheet; practice graph
Do your students for get how to graph like mine do? Keep this resource sheet in their binders all year so they can look back on the directions!This freebie is a real practical gem! Challenge students understanding of graphing with this activity where students find problems with already made graphs! Can you find the LINE GRAPHING MISTAKES? 8 Graph Task Cards ApplicationMore graphing activities here:Pendulum Inquiry/Lab -3 experiments, graphing, conclusions Scientific MethodMeasuring Mass Review
Subjects:
Grades:
5th - 10th
Types:
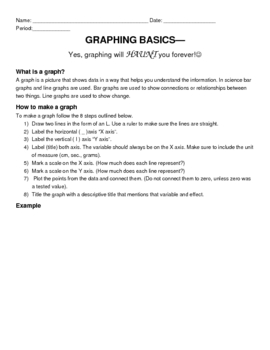
Creating Line Graphs in science-Basic Step by Step review directions & practice
This is a sheet i hand out to my science students for them to keep in the resources section of their binder. It has step by step directions on how to create a line graph. They use it whenever they are required to graph results to an experiment.Challenge students understanding of graphing with this activity where students find problems with already made graphs! Can you find the LINE GRAPHING MISTAKES? 8 Graph Task Cards ApplicationMore graphing activities here:Pendulum Inquiry/Lab -3 experiments,
Subjects:
Grades:
4th - 11th
Types:
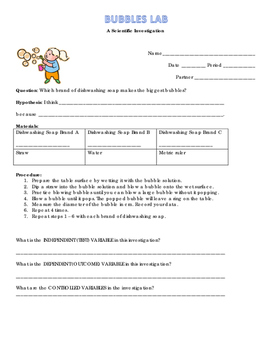
Bubble Lab - A Scientific Investigation
This SUPER fun activity allows students to practice their science investigation skills. Students work with a partner to investigate the properties of different bubble solutions. Students discuss manipulative and responding variables, generate a hypothesis, graph and analyze data, and then form conclusions based on their results. My kids always got a kick out this one...make sure to wear your safety goggles!
Subjects:
Grades:
5th - 9th
Types:
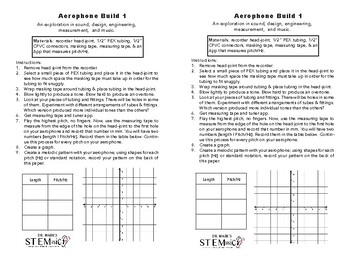
STEM Aerophone Build 01
This STEM/music activity allows kids to design, engineer, and build a wind instrument from PEX/CPVC and a recorder. Using this creative experience, kids measure sound and length to create a set of ordered graph pairs. For questions and guidance, info@drmarkstudio.com
Subjects:
Grades:
4th - 12th
Types:
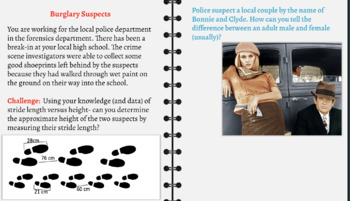
CER: Height vs. Stride Length
This is an easy and fun activity for students to practice their scientific skills in collecting and analyzing data, argumentation and writing a CER (Claim, Evidence and Reasoning). Very few materials are needed for this activity and it gets students moving and collaborating. This can be a great beginning of the year activity to review CER and get the students working together in small laboratory groups.
Subjects:
Grades:
6th - 12th
Types:
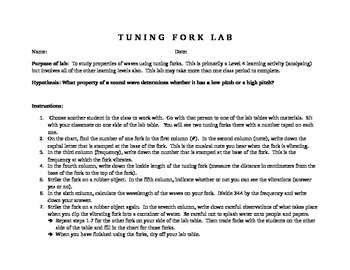
Tuning Fork Lab
If you have a set of tuning forks and lab space with running water, you can do this lab! Helps students visualize waves in general and sound waves in particular. Involves observing properties of waves, doing calculations, graphing, and thinking about what causes a sound to have a low or high pitch. Promotes healthy scientific discussion.
Subjects:
Grades:
9th - 12th
Types:
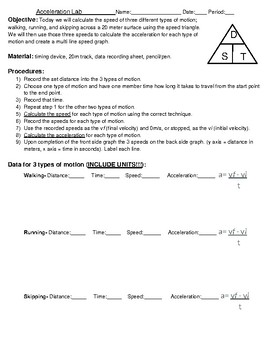
Acceleration lab - NGSS
In this lab students will calculate the speed of three different types of motion; walking, running, and skipping across a 20 meter surface using the speed triangle. They will then use those three speeds to calculate the acceleration for each type of motion and create a multi line speed graph.
Subjects:
Grades:
9th
CCSS:
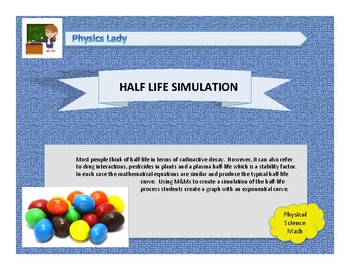
HALF-LIFE SIMULTION
Most people think of half-life in terms of radioaictve decay. However, it can also refer to drug interactions, pesticides in plants and a plasma half-‐life which is a stability factor. In each case the mathematical equations are similar and produce the typical half-life curve. Using M&Ms to create a simulation of the half-‐life process students create a graph with an exponential curve.
Subjects:
Grades:
7th - 12th, Higher Education
Types:
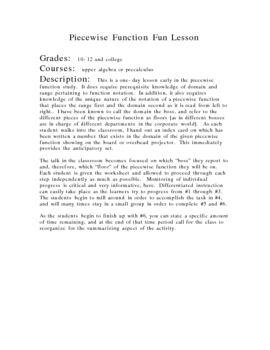
Piecewise Function Fun
This one-day lesson is good for early exploration of the piecewise function and how to obtain the graph of a piecewise function. Concepts such as domain and range and function notation are strengthened or assessed depending upon the learner. It is an activity which leads the learner step-by-step with group work possible and concludes with a whole-class discussion summary.
Subjects:
Grades:
10th - 12th
Types:
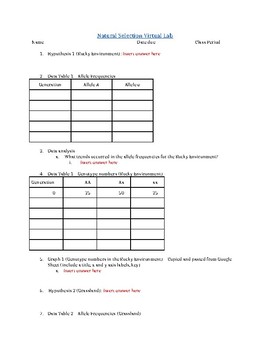
Evolution Activity
This is a virtual lab template that students can download and complete using the McGraw-Hill Natural Selection Virtual Lab website. Students complete the activity, gather the data, graph the data, and then draw conclusions from their data. There is a brief tutorial on Schooltube linked to the instructions to further aid students in lab completion.
Grades:
8th - 10th
Types:
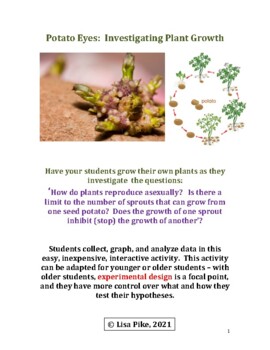
Plant Potato Eyes
In this lab we will investigate potato growth: do they regulate their sprout growth? Can every potato eye sprout, or is there a limit to the number of sprouts that can grow from one seed potato? Does the growth of one sprout inhibit (stop) the growth of another?
Subjects:
Grades:
4th - 12th, Adult Education
Types:
NGSS:
4-LS1-1
, MS-LS1-1
, HS-LS1-2
, MS-LS1-4
, HS-LS1-3
Lab - Sunspots
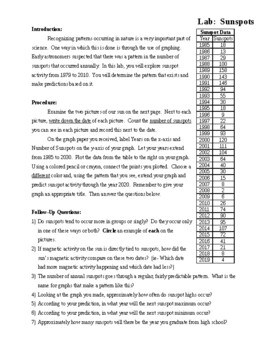
In this lab, students graph yearly sunspot data and make predictions about the future of the sunspot cycle.Additionally, there is currently an interactive here (https://www.pbs.org/wgbh/nova/labs/lab/sun/research) where students can count sunspots and compare their numbers to the actual data.If you like this, PLEASE rate it (favorably?) and consider purchasing some of my other work.
Subjects:
Grades:
9th - 12th
Types:
Science/Math - using Nearpod - GRAPHING INTRODUCTION LESSON 1
Are you looking for a tool that can freely supply a student with all the information needed to teach them with very little or no work from you? Well then this is the resource for you. This tool will prompt students with critical thinking exercises and challenges that address key ideas but supply the explanations as well. This teaching device can be provided to students in a full class forum or can be assigned as independent study. The following lesson is one of many to engage students in the ent
Grades:
3rd - 12th, Higher Education
Types:
CCSS:
Solving Quadratics using Technology
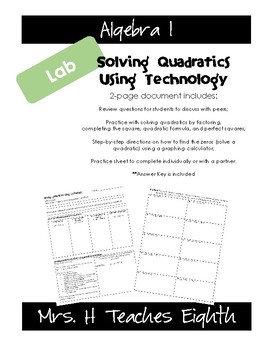
Two-page document includes: review questions for students to discuss with peers; practice with solving quadratics by factoring, completing the square, quadratic formula, and perfect squares; step-by-step directions on how to find the zeros (solve a quadratic) using a graphing calculator; and a practice sheet to complete individually or with a partner.
Grades:
8th - 9th
Types:
Quadratic Grapher
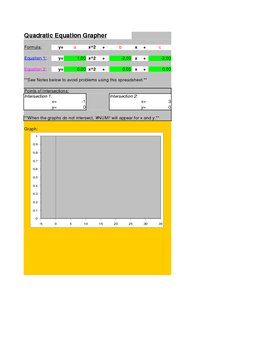
Quadratic Grapher MS Excel Spreadsheet graphs up to 2 quadratic equations / functions at a time. It is color coded so it is easy to see which parabola corresponds to which equation.
It also displays 10 points. The x values can be changed to your liking.
It also finds the points of intersection between the two parabolas. This is useful for solving a system of two quadratic equations. It could probably even solve a system of two equations that has one quadratic and linear equation. Just inp
Grades:
9th - 12th, Higher Education
Types:
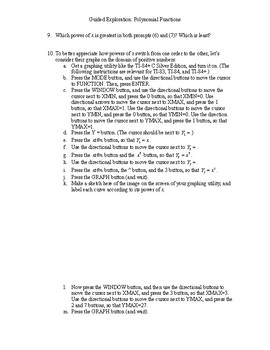
Guided Exploration: Polynomial Functions
42-item teacher-lead inquiry into properties and behavior of Polynomial Functions. Best used at the beginning of a unit on polynomial functions (before demonstrating how to solve textbook problems), this activity invites students to use inductive reasoning and class discussion to discover the big ideas behind graphing polynomial functions without a graphing utility.
Subjects:
Grades:
10th - 12th
Types:
CCSS:

Tootsie Pop Lab Experiment
Watch an old Tootsie Pop commercial and discover how many licks it takes to get to the center of a Tootsie Pop. (Tootsie Pops not included). Students will be able to use the scientific method to observe, create a hypothesis, find variables, collect data, and come to a conclusion. Then, collect data from the class! In the packet, students can record peer's results to be able to create a bar graph with their findings.
Subjects:
Grades:
5th - 9th
Types:
CCSS:
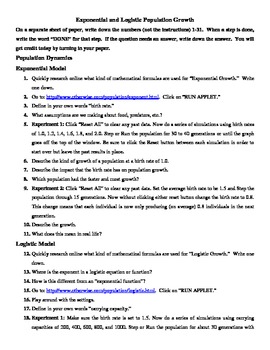
Exponential and Logistic Modeling Internet Project
Using the provided URL, the applet provides a population growth simulation for two scenarios: exponential and logistic. This worksheet presents an orderly way to explore both, taking into account pros and cons for each. May be used for solely exponential modeling, though the logistic modeling helps students judge between different types of mathematical modeling. Worksheet includes a total of 6 "Experiments" to run with the simulation. Can be done in a computer lab in one hour. May be used e
Subjects:
Grades:
9th - 12th
Types:
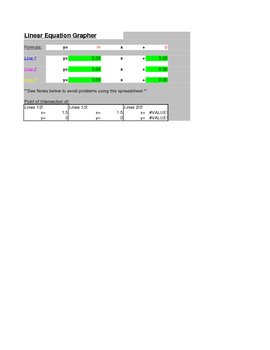
Linear Grapher
Linear Grapher Microsoft Excel Spreadsheet that allows you to graph up to 3 lines at a time. The lines are color coded with the equations, so you will know which line corresponds to which equation.
It also displays 10 points for each equation. The x values for these points can be adjusted.
It also finds the points of intersection for every pair of lines. This is helpful for system of equations.
It also has a seperate application built into the spreadsheet for finding the equation of a line
Grades:
8th - 12th, Higher Education
Types:
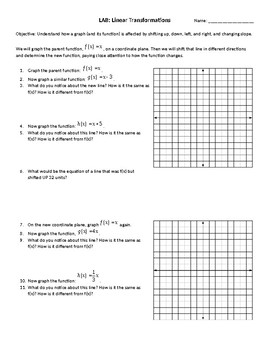
LAB: Linear Transformations
Students explore how a linear function changes (both graphically and algebraically) through observation. I highly recommend working through the first example as a class - or a similar example. But the best discussions happen when students work in groups and collaborate their hypotheses and conclusions.Feel free to make edits to adapt it to your needs! And as always, I would appreciate any feedback or ways to improve the lesson. Thank you!
Grades:
6th - 12th
Types:
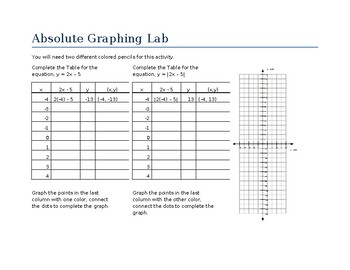
Absolute Value Graphing Lab
In this quick introductory lab, students will develop an understanding about the shape and properties of absolute value graphs by comparing contrasting similar linear and absolute value functions. Key included!
Subjects:
Grades:
7th - 12th
Types:
CCSS:

Video Game Experiment
A video game experiment to help (re)introduce your students to the scientific method and writing an experiment about it. Use video games to help students understand the scientific method by experimentation. They will conduct an experiment where they play video games with different independent variables, record their results, create a graph, and write a conclusion. Links to free video games are included in the document.
Subjects:
Grades:
4th - 9th
Types:

Electronic Student Grapher
The electronic student grapher is a simple program that can be used to demonstrate graphing linear lines and inequalities. This also can be used to allow students explore and demonstrate their ability to create graphs.
Subjects:
Grades:
7th - 12th
Types:
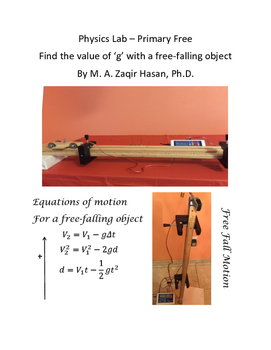
Find the Value of g for a free-falling object
This is a physics lab for students in Regular, Honors, IB, AP, & AICE programs. The lab shows the application of slope concept to find the value of g (gravitational acceleration) from the data collected.
Subjects:
Grades:
10th - 12th
Types:
Showing 1-24 of 33 results


