TPT
Total:
$0.00

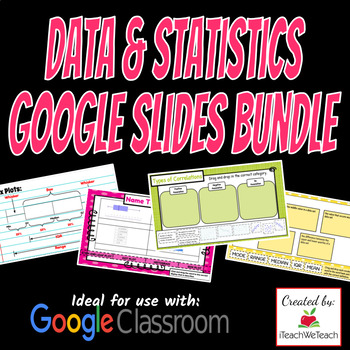
Statistics Bundle | Google Slides Activities | Download & Go!

Rated 5 out of 5, based on 3 reviews
5.0 (3 ratings)
;
iTeachWeTeach
113 Followers
Grade Levels
6th - 9th
Resource Type
Standards
Formats Included
  • Google Slides™
Pages
77 pages
$8.50
List Price:
$11.50
You Save:
$3.00
Bundle
$8.50
List Price:
$11.50
You Save:
$3.00
Bundle
Share this resource
Report this resource to TPT
iTeachWeTeach
113 Followers
Includes Google Apps™
This bundle contains one or more resources with Google apps (e.g. docs, slides, etc.).

Products in this Bundle (4)

    Description

    The bundle includes:

    Topics Include: mean, median, mode, range, maximum, minimum, measures of center, measures of spread, dot plots, box-and-whisker plots, histograms, and more.

    These activities are ideal for use with Google Classroom, but can be shared as a link on virtual classroom websites like Canvas, Schoology, etc. Digital interactive activities are great tools for learning and developing 21st century skills in students, as well as promoting student engagement in virtual classrooms! No copies or paper needed!

    LICENSING TERMS: This purchase includes a license for one teacher only for personal use in their classroom. Licenses are non-transferable, meaning they can not be passed from one teacher to another. No part of this resource is to be shared with colleagues or used by an entire grade level, school, or district without purchasing the proper number of licenses.

    Please review my terms of use.

    Check out my other products HERE.

    You can also follow me on:

    iTeachWeTeach Facebook

    iTeachWeTeach Instagram

    iTeachWeTeach Website

    iTeachWeTeach Pinterest

    Or email me at iTeachWeTeach@gmail.com

    Total Pages
    77 pages
    Answer Key
    Included
    Teaching Duration
    1 month
    Report this resource to TPT
    Reported resources will be reviewed by our team. Report this resource to let us know if this resource violates TPT’s content guidelines.

    Standards

    to see state-specific standards (only available in the US).
    Understand that a set of data collected to answer a statistical question has a distribution which can be described by its center, spread, and overall shape.
    Recognize that a measure of center for a numerical data set summarizes all of its values with a single number, while a measure of variation describes how its values vary with a single number.
    Display numerical data in plots on a number line, including dot plots, histograms, and box plots.
    Giving quantitative measures of center (median and/or mean) and variability (interquartile range and/or mean absolute deviation), as well as describing any overall pattern and any striking deviations from the overall pattern with reference to the context in which the data were gathered.
    Use measures of center and measures of variability for numerical data from random samples to draw informal comparative inferences about two populations. For example, decide whether the words in a chapter of a seventh-grade science book are generally longer than the words in a chapter of a fourth-grade science book.

    Reviews

    Questions & Answers

    113 Followers