Interactive Notebook NOTES: Mean Median Mode Range Quartiles Box Plot Histogram
- PDF
What educators are saying
Also included in
- This bundle includes all of our 7th grade math (pre-algebra) foldables that can be used on their own or in interactive notebooks (INB). This is all you will need to create a beautiful notebook that your students can save and use for reference year after year. Save over 35% when you buy them as a sPrice $75.00Original Price $139.00Save $64.00
Description
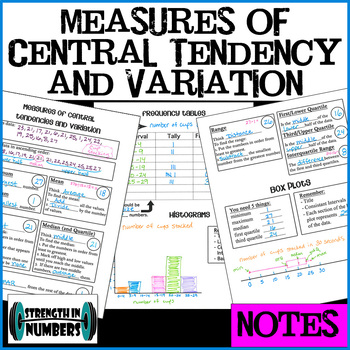
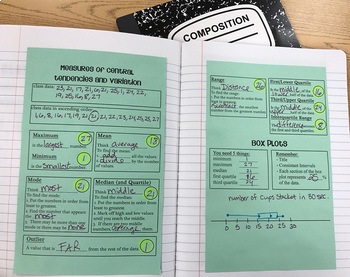
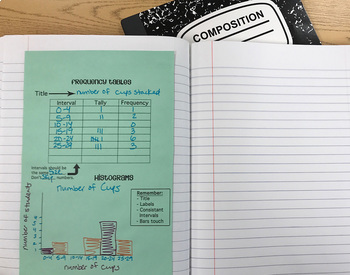
This set contains suggestions for student data collection and notes that use the data for measures of central tendencies and variation (mean, median, mode, range, first and third, quartiles, interquartile range, outliers), box plots, frequency tables, and histograms! Sounds like so much but these topics all go together so well. And by using data collected by students ABOUT students, they will be much more interested. This product contains ideas for collecting data, three full size (8.5x11) pages of notes, three half page notes that fit perfectly into a composition notebook, math journal, or interactive notebook, and sample notes filled out for you to use as a guide. This takes a couple of regular class periods or one period on the block schedule.


