8 results
High school statistics lessons for Microsoft Excel
Statistics Unit 9 Bundle - Hypothesis Testing (one sample) (18 days)
This is a unit plan bundle for a Statistics class. The plans include common core math standards, time frame, activities, enduring understandings, essential questions, and resources used. It is designed to last 18 days, depending on pacing. The plans include: 56-slide presentation, with annotated guide for reference5 Worksheets1 "Read & Respond" Article Worksheet2 Quizzes"Do Now" Entrance problemsSpreadsheet Activity - Hypothesis TestingReview slides (for peer presentations)Unit ReviewUnit Te
Subjects:
Grades:
10th - 12th, Higher Education
Types:
CCSS:
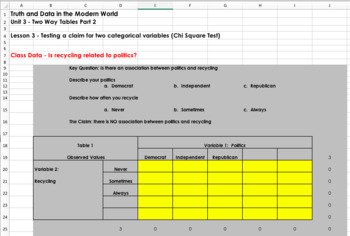
Teaching Statistics with Spreadsheets (Self Grading)
You can see a video that describes the basics of this course at the following link: https://www.youtube.com/watch?v=uZFpltXWyw8This package is an entire statistics course designed for content to be delivered, taught, practiced, and assessed through spreadsheets. Students learn basic statistics and spreadsheet skills. This course is intended to allow for student collaboration and group work throughout the learning process. Each spreadsheet is automatically graded so students can see their progres
Grades:
9th - 12th
Types:
Statistics Unit 8 Bundle - Confidence Intervals (19 days)
This is a unit plan bundle for a Statistics class. The plans include common core math standards, time frame, activities, enduring understandings, essential questions, and resources used. It is designed to last 19 days, depending on pacing. The plans include: 52-slide presentation, with annotated guide for reference5 Worksheets3 Quizzes"Do Now" Entrance problemsSpreadsheet Activity - T-DistributionReview slides (for review response system)Unit test (with review packet)Unit Project - Gather Data,
Subjects:
Grades:
10th - 12th, Higher Education
Types:
CCSS:
Graphs, Charts, and Tables: U.S. Census Data Study
This lesson uses data from the 2010 U.S. Census to allow students to access numbers and data in a social science classroom. The lesson is a 2 day mini-unit centered on working with charts, graphs, and tables (serves extremely well for SAT and ACT prep). This cross-curricular lesson draws meaningful parallels between math and social science, and the necessity of bringing these subjects together. The lesson uses a comparative look at Census data for California and the United States as a whole, but
Subjects:
Grades:
8th - 12th, Higher Education
Types:
Math - Data Management using Technology
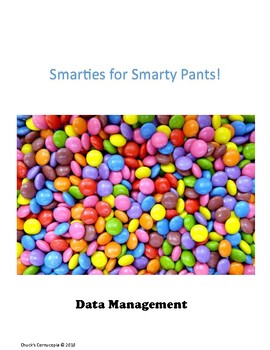
This lesson is a detailed example of how Microsoft Excel can help not only statisticians, but the regular student complete tasks in a way that is functional, efficient and easy to read. It is a fantastic tool that helps the student build an appreciation and awareness of how to communicate properly in math. This lesson will allow students to reflect on the topic of “mean” within Data Management and encourage them to clarify and build on their mathematical arguments.
Lastly, this is a perfect w
Grades:
5th - 9th
Draw 5 Cards Excel Simulator
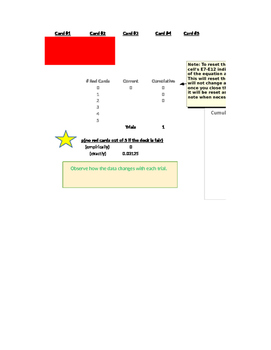
This Excel file is a simulator that draws five cards with replacement. It shows whether they are red or black and keeps track of the amount of red cards for each draw. This is then kept track in a table. As each trial continues, there is a graph showing how many red cards were drawn out of 5. Students will quickly see the importance of a large amount of trials as they see the middle of the graph grow quickly.
There is a probability worksheet available to be used in conjunction with this s
Subjects:
Grades:
7th - 11th
Types:
Guided Notes Data Supplement - Lesson 3.4
IB Applications & Interpretations:
Subjects:
Grades:
10th - 12th
Types:
Histograms and Summary Statistics in Excel
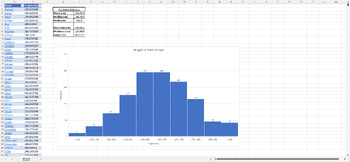
Embark on a journey through data analysis with our hands-on task, tailored specifically for Microsoft Excel. Utilising a compelling dataset on the heights of 1,000 individuals, educators can guide students through the intricacies of summary statistics and the visual appeal of histograms.SummaryThe Excel spreadsheet contains a list of 1000 names with a random height generated for each name. Students will use Microsoft Excel to:Find the mean, median, mode, and range of the datasetGenerate a histog
Grades:
8th - 10th
Types:
Showing 1-8 of 8 results


