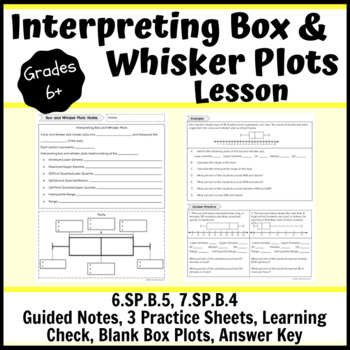
Interpreting Box and Whisker Plots Lesson- Notes, Practice, Learning Check
- PDF
What educators are saying
Also included in
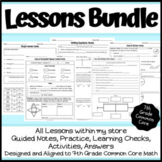
- This bundle includes all of the individual paper lessons currently sold in my store.Writing Two-Step EquationsUnit RatesSolving ProportionsSimple InterestBox and Whisker PlotsCircumferenceArea of CirclesArea of Composite FiguresAdding and Subtracting Integers Using a Number LineConverting Fractions,Price $10.00Original Price $19.50Save $9.50
Description
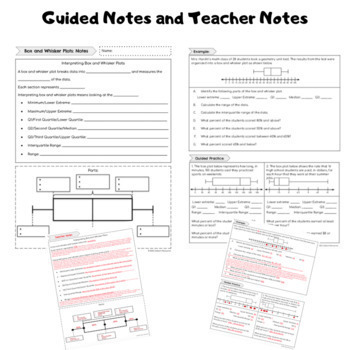
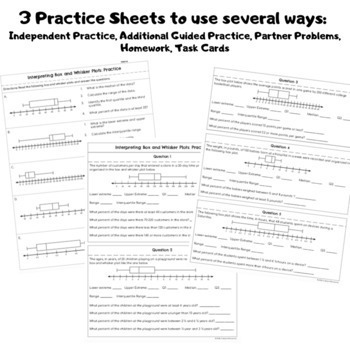
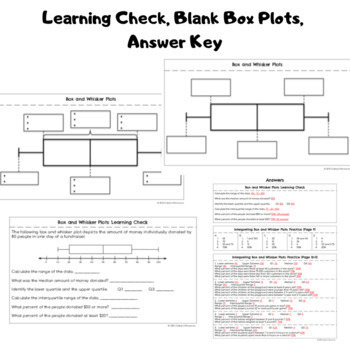
This interpreting box and whisker plots lesson consists of a guided notes sheet, 3 practice sheets, a learning check, 2 different half sheets of blank box plots and an answer key. You can hole punch the note pages and have students place them in their binders or a 3-prong folder. There are teacher notes to guide you through the direct instruction with students. There are three pages of practice. One page can be used as independent practice when students are ready; this could be in class or homework. The additional two practice sheets include word problems and real world context and can be used as whole class discussion (essentially more guided practice), partner practice, or even broken up to be task cards. I encourage any way that you use them to definitely go over the problems and really break down the data with students, asking follow up questions, and getting them to look at more than just the “parts” of the box plot. The learning check can be given as an exit slip or in the beginning of the following class as a warm-up. I provided two half sheets of blank box plots so that you can quiz students on their knowledge of the parts, use as bellwork, an exit slip, or so that students can place this page in their interactive notebooks. The last item is an answer key to help with quick and easy grading.
Please click on the preview to see if this resource is a good fit for your classroom and visit my store for additional lessons, activities, practice, technology, and resources along with some freebies. Also don't forget to click the green follow star so that you stay informed when something new gets added.
Need more lessons? Click here. And don't forget to download my free circumference lesson.
Clicking the green follow star or clicking here keeps you informed when a new lesson, practice, or activity is posted.

