842 results
High school statistics handouts under $5
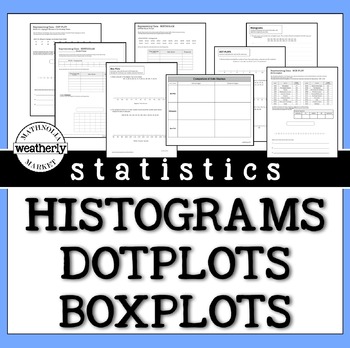
STATISTICS - Histograms, Dot Plots and Box Plots
There is no need to scour the internet for data. This resource includes the data and the format to challenge your students' skills with data displays.This packet includes worksheets that provide opportunities for students to create histograms, dot plots, and box plots.They can be used as guided practice or as "on your own" activities.INCLUDES3 worksheets with realistic data.3 worksheets with REAL data (Apple stock prices, US Olympic athlete ages, and the Oscars:Best Picture/ Movie Times)AND 3 wo
Subjects:
Grades:
6th - 9th
Types:
CCSS:
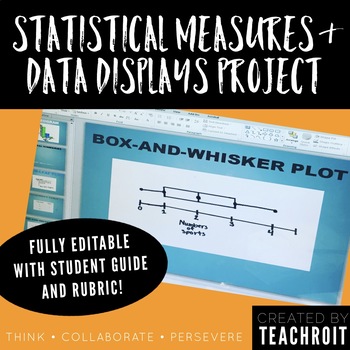
Statistics & Data Display Project for 6th Grade Math PBL (Fully Editable)
This product includes a student guide for a 6th grade middle school mathematics project that will require students to develop a statistical question, conduct a survey with their classmates, create numerical summaries, represent their findings using visual data displays, and finally present their findings! The thorough student guide provides step by step directions for each part of the project and could be used as either an in class project or to be assigned as homework. The student guide also in
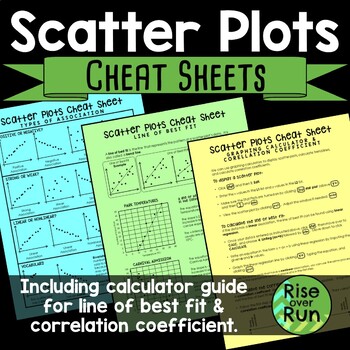
Scatter Plot Cheat Sheets Printable Guided Notes
Detailed sheets for the following topics: •Types of Association & VocabularyThis page shows examples of positive, negative, strong, weak, linear, and nonlinear association. It also shows clusters and outliers.•Line of Best FitThis page explains what a line of best is (or trend line) along with examples and nonexamples. It has 2 real world connections and how to interpret the line of best fit.•Graphing Calculator Guide & Correlation CoefficientThis sheet gives step by step instructions fo
Subjects:
Grades:
8th - 9th
CCSS:
Also included in: 8th Grade Math Activities & Lessons Bundle for the Whole Year
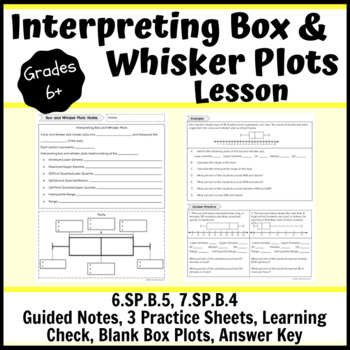
Interpreting Box and Whisker Plots Lesson- Notes, Practice, Learning Check
This interpreting box and whisker plots lesson consists of a guided notes sheet, 3 practice sheets, a learning check, 2 different half sheets of blank box plots and an answer key. You can hole punch the note pages and have students place them in their binders or a 3-prong folder. There are teacher notes to guide you through the direct instruction with students. There are three pages of practice. One page can be used as independent practice when students are ready; this could be in class or homew
Subjects:
Grades:
6th - 10th
Types:
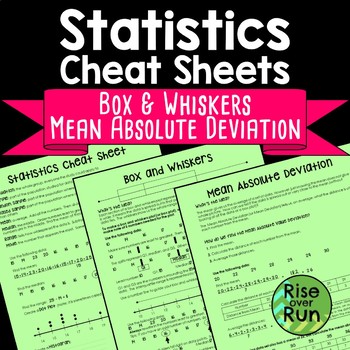
Box and Whiskers and Mean Absolute Deviation Cheat Sheets
Help students understand statistics vocabulary, dot plots, histograms, and box and whiskers diagrams, and mean absolute deviation with this resource.The three-page handout comes in two formats:Reference “Cheat Sheet” with all information filled in (pages 2-4)Guided Notes format with fill-in blanks and practice problems (pages 5-7)The first sheet defines important terms and helps students understand dot plots (or line plots) and histograms. The second sheet guides students in creating a box and w
Subjects:
Grades:
6th - 9th
Types:
CCSS:
Also included in: 7th Grade Math Activities, Lessons, Projects & More Bundle
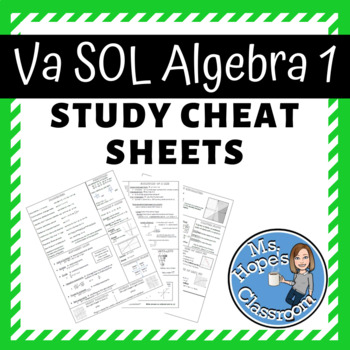
Algebra 1 Review Cheat Sheet for SOL!
REVIEW SHEETS THAT INCLUDE THE FOLLOWING TOPICS:Coordinate PlaneDirect and Inverse VariationDomain and RangeEquations of a LineExponent LawsFactoringFunctionsGraphing InequalitiesLine and Curve of Best FitMultiplying PolynomialsPropertiesQuadraticsScatter plotsSlope and GraphingSquare and Cube RootsSystems of EquationsI give this sheet to my students as we prepare for the SOL tests so that if they get stuck, they can refer to the sheet to help jog their memory.Calculator instructions for various
Subjects:
Grades:
7th - 11th
Types:
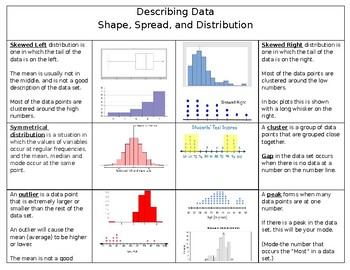
Describing Data based on shape, spread, and distribution
This is a quick foldable already put together for students to use as a reference when describing data based on its shape, spread, and distribution. It goes along with the 6th grade statistics standards.
When printing you should select two sided and print on short edge.
I got the idea from Bailey's corner, but I wanted to make a few changes. Here is the link to her store if you would like to check hers out.
https://www.teacherspayteachers.com/Product/Dot-Plots-and-Describing-the-Shape-of-Data-
Subjects:
Grades:
5th - 9th
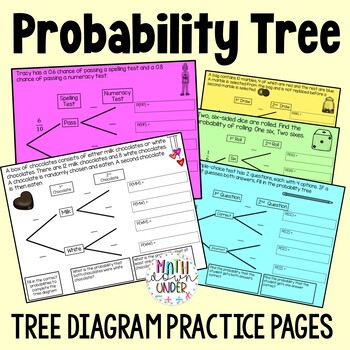
Probability Tree Diagrams Practice Pages - Independent and Dependent Events
Your students will love practicing drawing tree diagrams to solve compound probability events with these 10 printable practice pages. Independent and Dependent events are included.Starting with structured scaffolding, students are introduced to the process of creating probability trees by filling in the blanks. This approach builds confidence and ensures students grasp the fundamentals before advancing. Gradually, the scaffolding is removed, presenting blank templates that encourage students to
Subjects:
Grades:
6th - 10th
Types:
Also included in: Compound Probability Activity & Practice Bundle

Two-Way Tables and Relative Frequency Doodle Notes
Doodle notes are a tool to help students process information. I’ve found students are more engaged when using doodle notes than traditional notes, and they’re more likely to keep the notes and use them as references.
What’s Included:
The first version of the notes has pre-filled data from a hypothetical class. All of the calculations included on the answer key use this data.
The second version of the notes has a blank table so you can collect data from your class with your students. My s
Subjects:
Grades:
8th - 9th
Types:
CCSS:
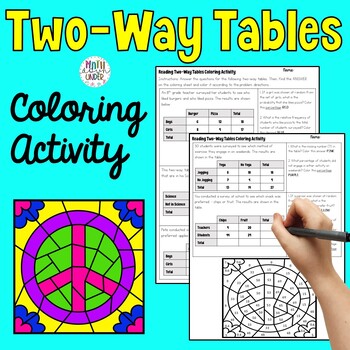
Two-Way Tables and Relative Frequency Coloring Activity
Your students will love practicing reading and interpreting two-way frequency tables in this fun, color by number activity! 13 problems to solve and a peace sign mosaic to color according to the question instructions. Perfect for your Data & Statistic Unit! The entire product is viewable in the preview file. Please follow my store and thank you for your support!Great for:ReviewMath CentersChoice BoardsHomeworkEarly finishers
Subjects:
Grades:
8th - 9th
Types:
CCSS:
Also included in: Two-Way Tables - Math Activity Bundle
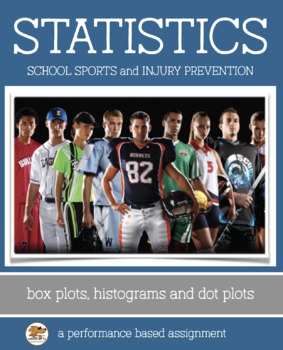
STATISTICS - Histograms, Box Plots, Dot Plots: A Performance-Based Task
Using Statistics in a Real World Scenario
Sports Injury and School Athletes
This packet includes two activities. The first activity guides students through 3 data analyses projects including identifying the best data display (box plot, histogram, dot plot) for the situation. The second activity is a performance task which asks students to critique the reasoning of others and refute a claim. In the process, students will learn that correlation does not imply causation. This can be independently
Subjects:
Grades:
8th - 11th
Types:

Moneyball Movie Guide & ANSWERS | Moneyball Worksheet | Questions (2011)
Moneyball movie questions (released 2011) help keep students engaged throughout the film by providing 26 questions for them to answer to keep them on track. Moneyball worksheet comes with a key that has suggested answers provided at the end.Moneyball Movie Guide follows Billy Beane, general manager of the Oakland A's as he an epiphany about baseball's conventional wisdom is all wrong. Faced with a tight budget, Beane must reinvent his team by outsmarting the richer ball clubs. Joining forces wi
Subjects:
Grades:
5th - 12th
Types:
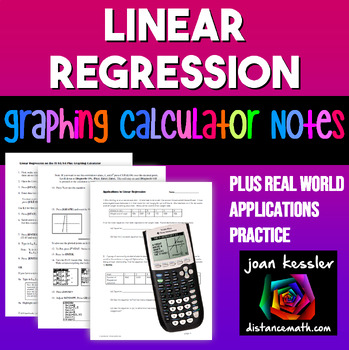
Linear Regression | TI-84 Graphing Calculator plus Applications
This clear, concise, step by step notes help your students use the TI 83 and TI 84 Graphing Calculator to enter data into lists, create a linear regression equation and to plot the equation along with the data simultaneously. Also included is a 3 page worksheet with five real world examples for students to practice. Solutions included. These can be used as Binder Notes or printed smaller for Interactive Notebooks._________________________________________________Related Products★ Quadratic Re
Subjects:
Grades:
9th - 11th, Higher Education
Types:
CCSS:
Also included in: Linear Functions and Systems Algebra 2 Unit 2 Activity Bundle
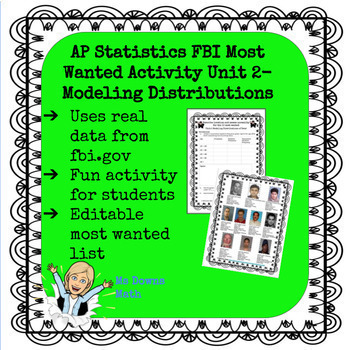
FBI Most Wanted AP Statistics, Modeling Data, Z scores and Normal Distributions
I created a series of activities for several units in the AP Statistics curriculum. The students love using data from fbi.gov to review concepts. This activity involves analyzing data related to the top 10 most wanted fugitives. I created this activity in May of 2020 and used the top 10 at that time. In the folder, you will find an editable slide of the top 10 if you want to change it.The answer key for the unit is based on the original top 10 that I used. Teachers have the option of having stud
Subjects:
Grades:
9th - 12th
Types:
CCSS:
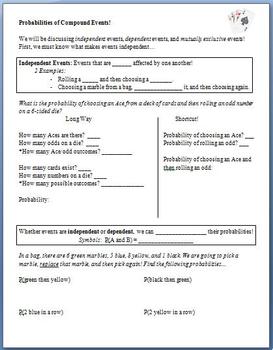
Probability of Compound Events (Guided Notes)
This lesson is meant to be used as guided notes for a whole class.
Students begin by learning what makes 2 events independent. After slowly working through a problem about rolling a die and choosing a card, they discover that they can multiply probabilities when working with these compound events. They then attempt problems involving picking marbles from a bag. Next, they learn about dependent events, and finally, mutually exclusive events.
The last 2 pages are a copy of the key.
Subjects:
Grades:
6th - 12th
Types:
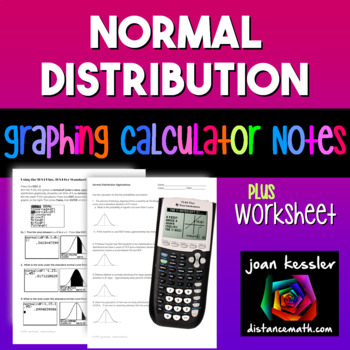
Normal Distribution | TI-84 Calculator Reference Sheet and Practice
With this Normal Distribution concise, step by step handout, your students will learn how to use the TI 83 and TI 84 Graphing Calculators to find probabilities for the Standard Normal Distribution and also find probabilities for Applications to the Standard Normal Distribution. They will also learn how to use the shade feature to construct a graph and have the calculator shade in the appropriate region.These can be used as Binder Notes or printed smaller for Interactive Notebooks.Note: This han
Subjects:
Grades:
9th - 12th
Types:
CCSS:
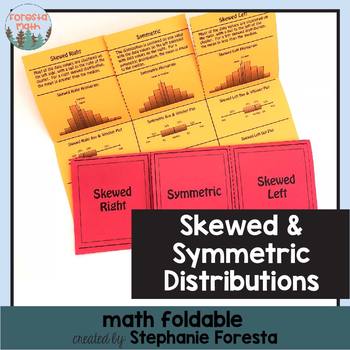
Skewed and Symmetric Distributions Math Foldable
A fun foldable with skewed and symmetric distributions (histograms, box & whisker plots, and line plots).
Subjects:
Grades:
7th - 11th
Types:
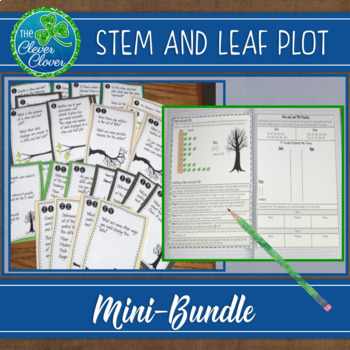
Stem and Leaf Plots - Guided Notes, Task Cards & an Assessment
This stem and leaf plot resource includes guided notes, a practice page, task cards and an assessment. Your students will have the opportunity to discuss the measures of central tendency and to analyze and create stem and leaf plots. Below, you will find detailed explanations on the notes, practice problem, task cards and the assessment.
Guided Notes
Included, you will find a guided page of notes that students can use to create their stem and leaf plots. The notes include step by step instruct
Subjects:
Grades:
6th - 9th
Types:
CCSS:
Also included in: Statistics Bundle - Guided Notes, Worksheets & Scavenger Hunts!
Standard Deviation Activity
This activity is scaffolded at each step so they can find the standard deviation of a data set independently. The fun part is that they collect their data by recording scores of an "Are You Smarter Than A 5th Grader?" quiz! Due to the scaffolded nature of this activity, it would be perfect for distance learning with some modifications. For example, they could collect data points by quizzing parents/family members. Or you can provide data points for them. Here's how I did it:1. As a warm-up, I ga
Subjects:
Grades:
8th - 12th

Hypothesis Test for a Population Mean - Analogy to a Criminal Trial
This is a student workbook that can supplement lessons on hypothesis testing for a population mean. The preview gives an example of pages from the workbook.I teach the stages of hypothesis testing using analogies to a criminal trial. My students like this comparison; they are more engaged and it helps them to see the relevance of the different stages. Once students are confident with the terminology, we create our own courtroom in the classroom and role-play the stages of hypothesis testing with
Subjects:
Grades:
9th - 12th
Finding Mean, Median, Mode, and Range
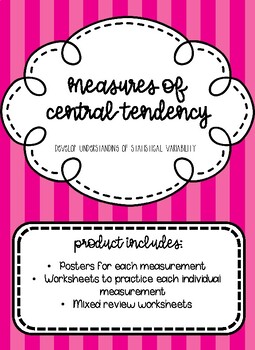
Simple worksheets (5 problems each) to introduce and practice finding the mean, median, mode, and range of a data set. Have students complete with or without calculator, depending on their instructional level. Product includes:-Reference posters for mean, median, mode, and range. Each poster includes the measures' definitions and directions for how to find them with an example.-5 worksheets about finding the mean.-5 worksheets about finding the median.-5 worksheets about finding the mode.-5 work
Subjects:
Grades:
1st - 12th
Types:
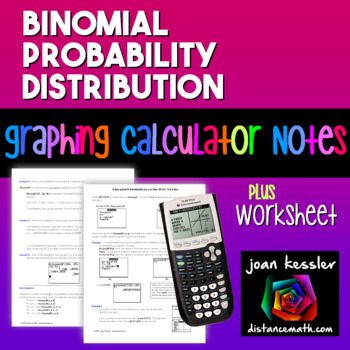
Statistics Binomial Probability Distribution TI-84 Reference Sheet and Practice
This Binomial Probability Distribution Reference Sheet and Practice for the TI-83 TI-84 Plus will help your students and give them the tools to work through problems in Statistics. These can be used as Binder Notes or printed smaller for Interactive Notebooks.IncludedEasy to follow handout helps you teach your students how to to find Binomial Probabilities on the TI-83 Plus and TI-84 Plus Graphing Calculators. The handout is a concise 2 page guide with examples. Great to add to your students
Subjects:
Grades:
10th - 12th, Higher Education
Types:
CCSS:
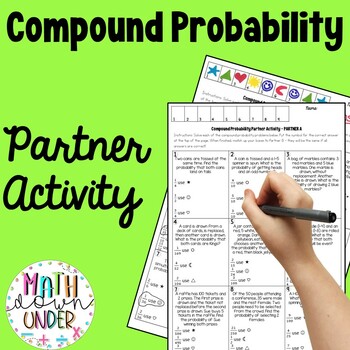
Compound Probability - Partner Activity (Independent and Dependent Events)
Your students will love practicing finding the probability of compound events (with and without replacement) in this fun, printable partner activity! Have a look at the thumbnails and preview file to get a better idea of what this resource looks like.Great for:ReviewPartner WorkCover lessonsExtra PracticeInstructions:1.Divide students into pairs2.Give “Partner A” sheet to one student and “Partner B” to the other. The questions are different!3.Partners will work independently to solve the problem
Subjects:
Grades:
7th - 9th
Types:
CCSS:
Also included in: Compound Probability Activity & Practice Bundle
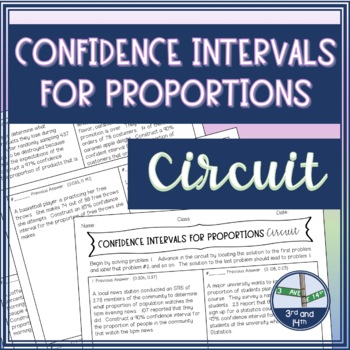
Confidence Intervals for Proportions Circuit Activity
Students will practice constructing confidence intervals for proportions. This activity requires no prep - just print, copy and go!What is a circuit? Students begin at question #1, solve the problem then look for the answer on the worksheet. When they find the answer to #1, they label that problem #2, and so on. The answer to the last problem will lead them back to #1. This provides a self-checking component.What's Included:12 problems asking students to construct confidence intervals for propo
Subjects:
Grades:
9th - 12th
Types:
CCSS:
Showing 1-24 of 842 results


