187 results
High school statistics study guides under $5
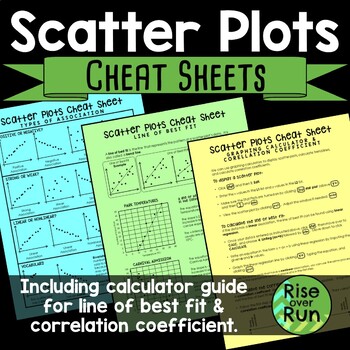
Scatter Plot Cheat Sheets Printable Guided Notes
Detailed sheets for the following topics: •Types of Association & VocabularyThis page shows examples of positive, negative, strong, weak, linear, and nonlinear association. It also shows clusters and outliers.•Line of Best FitThis page explains what a line of best is (or trend line) along with examples and nonexamples. It has 2 real world connections and how to interpret the line of best fit.•Graphing Calculator Guide & Correlation CoefficientThis sheet gives step by step instructions fo
Subjects:
Grades:
8th - 9th
CCSS:
Also included in: 8th Grade Math Activities & Lessons Bundle for the Whole Year
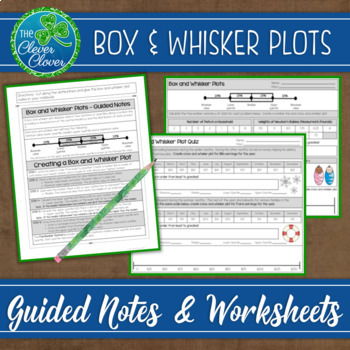
Box and Whisker Plots: Notes, Worksheets and an Assessment
This resource includes detailed step by step notes on how to create a box and whisker plot, a worksheet and an assessment.
The notes include step by step instructions that can be referenced as students study box plots. Students can glue the notes directly into their notebooks. A box and whisker plot visual is used to display the four quartiles of data. As students complete each step, they will determine the five-number summary used to create a box and whisker plot. The guided notes address
Subjects:
Grades:
6th - 9th
Also included in: Statistics Bundle - Guided Notes, Worksheets & Scavenger Hunts!
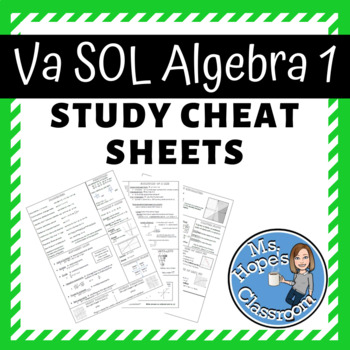
Algebra 1 Review Cheat Sheet for SOL!
REVIEW SHEETS THAT INCLUDE THE FOLLOWING TOPICS:Coordinate PlaneDirect and Inverse VariationDomain and RangeEquations of a LineExponent LawsFactoringFunctionsGraphing InequalitiesLine and Curve of Best FitMultiplying PolynomialsPropertiesQuadraticsScatter plotsSlope and GraphingSquare and Cube RootsSystems of EquationsI give this sheet to my students as we prepare for the SOL tests so that if they get stuck, they can refer to the sheet to help jog their memory.Calculator instructions for various
Subjects:
Grades:
7th - 11th
Types:
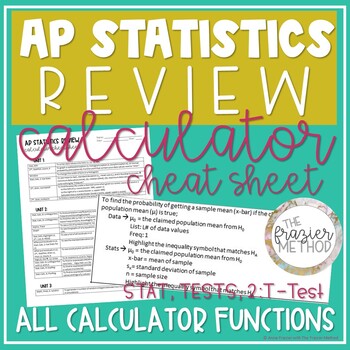
AP Statistics Review - Calculator Cheat Sheet for TI-84 Plus CE on AP Stats Exam
AN ENTIRE YEAR OF STATISTICS CALCULATOR FUNCTIONS for the TI-84 PLUS CE or TI-84 PLUS!!! Is AP Statistics hard? Not with this all-in-one AP Statistics calculator cheat sheet! Use this AP Statistics worksheet of calculator functions to help your students review for the AP Stats Exam! This AP Statistics reference sheet includes calculator functions from Units 1-7 - such as linear regression, probability formulas, graphs, re-expression, confidence intervals hypothesis tests, and more! This is a one
Subjects:
Grades:
9th - 12th, Higher Education
Types:
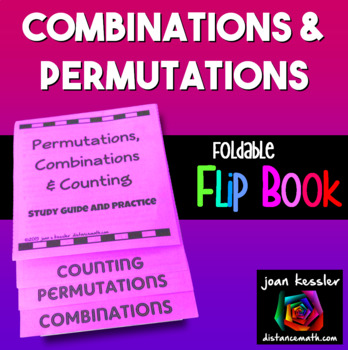
Permutations and Combinations Foldable Flip Book
This Flip Book includes guided notes and practice on Combinations, Permutations, and the Counting Principles.There are 19 problems for students to complete including a challenge problem on the back which is great for differentiation and early finishers. This makes a great study guide.The Flip Book is a perfect size for traditional or Interactive Notebooks, or just to use for studying for a test. Final size 4¼″ x 6½″. This is easy to make, no glue, no mess. Print one page double-sided, make one
Subjects:
Grades:
8th - 11th
CCSS:
Also included in: Algebra 1 Activity Bundle
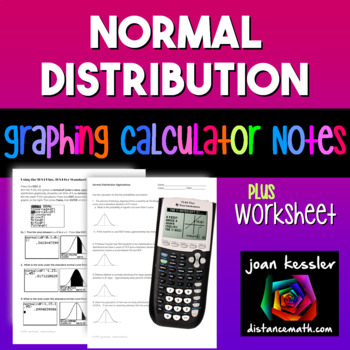
Normal Distribution | TI-84 Calculator Reference Sheet and Practice
With this Normal Distribution concise, step by step handout, your students will learn how to use the TI 83 and TI 84 Graphing Calculators to find probabilities for the Standard Normal Distribution and also find probabilities for Applications to the Standard Normal Distribution. They will also learn how to use the shade feature to construct a graph and have the calculator shade in the appropriate region.These can be used as Binder Notes or printed smaller for Interactive Notebooks.Note: This han
Subjects:
Grades:
9th - 12th
Types:
CCSS:
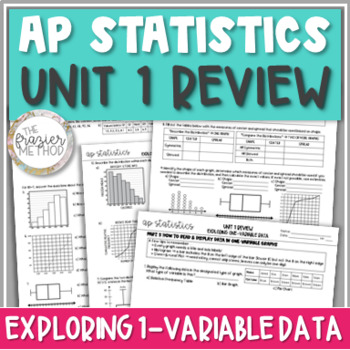
AP Statistics Review of Normal Distribution Histogram Box Plot Shape & Center
5 PAGES on histograms, boxplots, dot plots, stem-and-leaf, 5 number summary, percentiles, symmetric or skewed shape, median or mean for center, standard deviation or interquartile range for spread, outliers, Normal Distribution, z-scores, and more! This AP STATS EXAM REVIEW for Unit 1: Exploring One-Variable Data is great AP Stats Exam prep without the same old boring multiple choice problems or free response questions! Aligns with AP College Board’s updated 2019-2020 objectives and standards fo
Subjects:
Grades:
10th - 12th
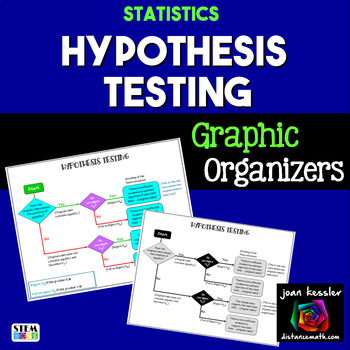
AP Statistics Hypothesis Testing Graphic Organizer
This Hypothesis Testing Graphic Organizer will help your students analyze and determine the correct wording for the results of a Hypothesis test. There are two versions of the organizers, one with H1 notation and the other with HA notation for the alternative Hypothesis. The preview only shows H1.There are five formats for the each of the version: Black and White, Color, with and without p -value info for rejection, and a two-to-a-page version as a paper saver. Please zoom in on the preview t
Subjects:
Grades:
9th - 12th
CCSS:
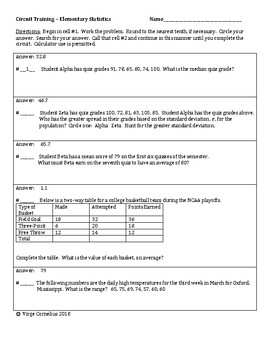
Circuit Training - Elementary Statistics
This 20-question circuit has it all for a beginning stats review!
Questions about mean, median, mode and range.
Questions with two-way tables and questions with frequency tables.
Questions about quartiles and inter-quartile range.
A question which asks students to compare the standard deviations of two data sets.
Even a question to determine if a data set has an outlier.
Students will be asked to sketch a box and whisker plot and a histogram.
These are all basic questions which stude
Subjects:
Grades:
8th - 11th
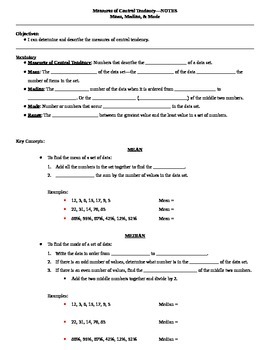
Measures of Central Tendency Guided Notes
These are guided notes for a lesson on measures of central tendency including mean, median, mode, and range. There are several examples in the notes and the same data sets are used to show each measure of central tendency.I have also included a teacher key to show you what to fill in the blanks as your students follow along.To use these notes, I simply projected them onto my whiteboard, gave the students their blank copies, and had them follow along and write what I wrote. This works great when
Subjects:
Grades:
5th - 12th
CCSS:
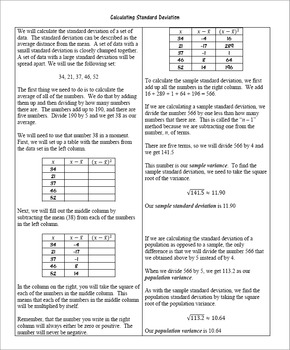
Standard Deviation Worksheet
This is a step-by-step walkthrough of how to calculate both sample and population standard deviation. (It does not contain a definition of sample and population, however.) It includes six practice problems on the other side as well as a detailed answer key including showing all the work.
Subjects:
Grades:
7th - 10th
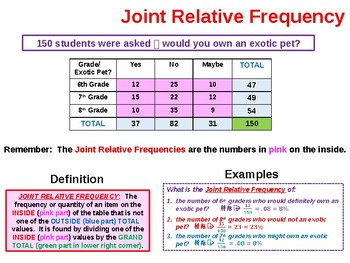
Two Way Frequency Tables Summary
This MS PowerPoint presentation provides background information on 2-Way Frequency Tables as well as the specific steps to follow create and analyze them. It is used to kickoff our study of this subject n my Pre-Algebra and Math I classes. It addresses all of the terms encountered in the construction and use of 2-Way tables including Joint Relative Frequency, Marginal Relative Frequency and Conditional Relative Frequency. It is a totally animated ppt file and very easy for students to underst
Subjects:
Grades:
8th - 10th
AP Statistics Review - Sampling Distributions of Sample Proportions & Means
Use this AP Statistics REVIEW OF SAMPLING DISTRIBUTIONS OF SAMPLE PROPORTIONS & SAMPLE MEANS for AP Statistics Exam prep whether you’re teaching in-person or distance learning! Students will calculate the probability, mean, and standard deviation of a sampling distribution of sample proportions or means. The answer key includes the work for every problem using both FORMULAS and TI-84 PLUS CE CALCULATOR FUNCTIONS. Aligns with AP College Board's updated 2019-2020 objectives and standards for
Subjects:
Grades:
10th - 12th
Types:
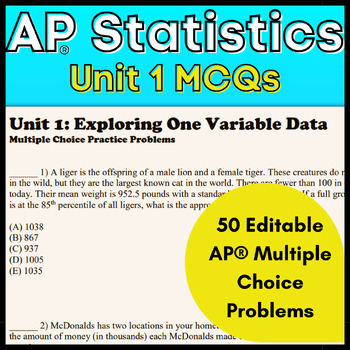
Goldie's AP® Statistics Multiple Choice Questions for Unit 1
AP® StatisticsUnit 1: Exploring One Variable DataMultiple Choice Questions (MCQ) Practice Included in this product:50 AP-level multiple-choice questions in an editable Word documentAnnotated answer key for all problems. Work is shown so you see exactly how I get the correct answerThese are BRAND NEW questions that I have developed for AP Statistics Unit 1. These questions are not used anywhere else in my resources; they are unique to this resource alone. Ideas for using this resource:✅Extra prac
Subjects:
Grades:
10th - 12th
Types:
CCSS:
Also included in: Goldie's AP® Statistics Semester 1 Multiple Choice Questions Bundle
Probability Notes and Practice Mega Bundle
28 pages of engaging probability concepts with concise and digestible explanations! Engage students with real life probability concepts and connections as they dive into mutually exclusive and overlapping events, set notation, independent and dependent events, conditional probability, tree diagrams, two-way frequency tables, Venn diagrams, and combinatorics (fundamental counting principle, permutations, combinations). Key included with all work shown!
Subjects:
Grades:
8th - 12th
CCSS:
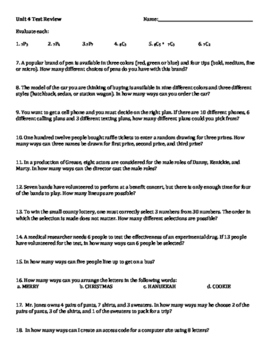
Review Packet- Combinations, Permutations, Probability
This is a review packet to use before a test or quiz over combinations, permutations, probability, and compound probability of independent and dependent events. I use this review for my Algebra 2 courses. There are 38 review problems.
Subjects:
Grades:
7th - 12th
Types:
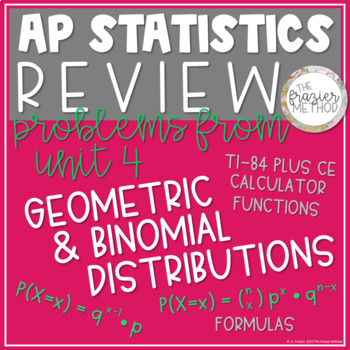
AP Statistics Review - Binomial Distributions & Geometric Distributions, Unit 4
Use this AP Statistics REVIEW OF BINOMIAL & GEOMETRIC DISTRIBUTIONS to help your students prepare for the AP Statistics Exam whether you’re teaching in-person or distance learning! Students will calculate the probability, mean (expected value), and standard deviation of a binomial random variable and a geometric random variable. The answer key includes the work for every problem using both the geometric and binomial probability FORMULAS and TI-84 PLUS CE CALCULATOR FUNCTIONS – geometpdf, geo
Subjects:
Grades:
10th - 12th
Types:
Graphic Organizers Bundle (AP Statistics)
This set of graphic organizers contains one graphic organizer for each main unit in the AP Statistics curriculum. The graphic organizers specifically follow the chapters in order for The Practice of Statistics (Yates, Moore, Starnes) Fourth edition, but of course, can be used to supplement any AP Statistics curriculum or textbook. Each graphic organizer page has all the key concepts for each unit conveniently on one succinct page, which makes it perfect for brainstorming, reviewing, and studying
Subjects:
Grades:
10th - 12th
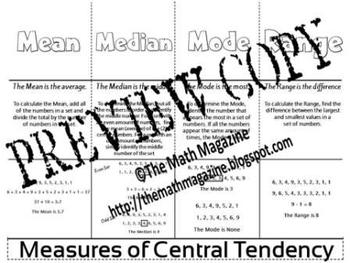
Measures of Central Tendency Mean Median Mode Foldable 6.SP.A.1, 7.SP.1, S-ID.2
Measures of Central Tendency Mean Median Mode Foldable 6.SP.A.1-3, 7.SP.1-4, S-ID.2
This is a single page PDF foldable that explains the Measures of Central Tendency: Mean, Median, Mode and Range.
The foldable includes: the definition of each term, an explanation of the correct ways to determine each and an example of each.
The folding directions are included with the purchased file.
BONUS: (2) FREE ITEMS are included as my way of thanking you for your interest in my items.
Follow me on T
Grades:
5th - 12th, Adult Education
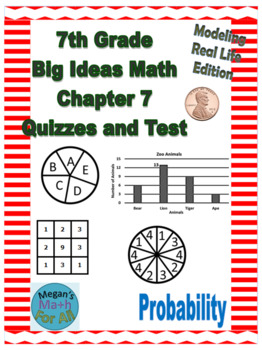
7th Grade Big Ideas Math Chapter 7 Quizzes and Test-Common Core/MRL ED-Editable
Howdy, Update November 2023: I have added an editable Google Doc Version of the file.Are you using 7th Grade Big Ideas Math? Here are some great quizzes and a test for you. I have written two quizzes and a test for Chapter 7 – 2019 Common Core/Modeling Real Life Edition. There are lots of questions completely aligned to most summative tests. This is a no prep product. The questions are carefully crafted, and the pages are formatted for easy correcting. You will get great data and information
Subjects:
Grades:
7th - 9th
Types:
Also included in: 7th Big Ideas Math All Chapters Quizzes and Tests Bundle - Editable
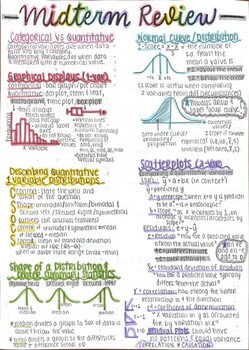
AP Statistics Midterm Review Study Guide
Handwritten Review for AP Statistics Midterm (Semester 1) ContentThis review sheet includes Unit 1 - 4 which covers:Univariate DataCategorical & Quantitative Summary StatisticsBivariate Data (Scatterplots & Two Way Tables)Sampling & Experimental DesignProbability & Random Variables
Subjects:
Grades:
10th - 12th
Types:
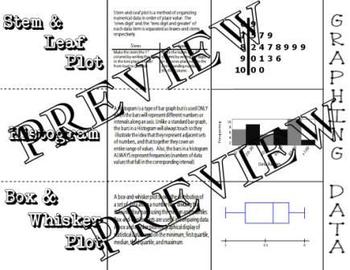
Graphing Data Histogram Box Whisker Stem Leaf Plot Foldable Interactive Notebook
Graphing Data Histogram Box Whisker Stem Leaf Plot Foldable Interactive Notebook
This is a single page PDF foldable that explains the differences in Histograms, Box and Whisker Plots and Stem and Leaf Plots, as well as shows an example of each.
The folding directions are included.
All feedback is welcomed
Follow Me on TpT!
Subjects:
Grades:
4th - 12th, Adult Education
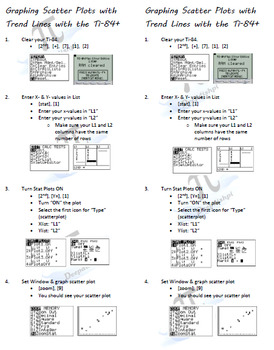
Scatterplots & Linear Regression (Trend Line) on Ti-84 (student notes)
This is a simple step-by-step list for student interactive notebooks.
Steps walk students through entering data, graphing the scatterplot and linear regression (tend line) in the Ti-83/84 family of graphing calculators. Screen shots of what the students see on their Ti are also included to encourage autonomy after initial instruction.
It is ready to be copied as a double-sided page and cut in half (long-wise), saving you precious paper! I hope you find this resource helpful!
TEKS
8.11(A)
Subjects:
Grades:
8th - 12th, Higher Education, Adult Education
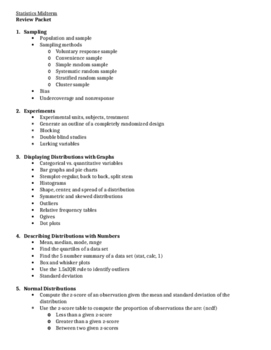
Statistics Midterm Review
This is a 50 question review for a regular level statistics midterm (not AP). Topics include:
Sampling and Experiments
Displaying Distributions with Graphs
Describing Distributions with Numbers
Normal Distributions
Scatterplots and Correlation
Linear Regression and Residuals
Subjects:
Grades:
10th - 12th
Showing 1-24 of 187 results


