Scatter Plot Cheat Sheets Printable Guided Notes
Rise over Run
23.9k Followers
Grade Levels
8th - 9th
Subjects
Resource Type
Standards
CCSS8.SP.A.1
CCSS8.SP.A.2
CCSS8.SP.A.3
CCSSHSS-ID.B.6
CCSSHSS-ID.B.6a
Formats Included
- PDF
Pages
3 pages
Rise over Run
23.9k Followers
What educators are saying
This was great to help supplement and explain various concepts related to scatter plots. Very useful and relevant to the real world. Thank you!
Also included in
- If you enjoy teaching students using discovery learning and engaging activities with real world connections, this huge pack of resources is here to help you plan your entire year of 8th grade math.Lessons help you teach the standards, encourage discussions, and challenge students to think. StudentsPrice $225.00Original Price $386.46Save $161.46
- Do you love discovery learning, collaboration, hands-on activities, and projects that help students make sense of the math they are learning? This curriculum is packed with engaging and challenging Algebra I and 8th grade math resources for the whole year. A variety of activities, inquiry learningPrice $350.00Original Price $677.94Save $327.94
- This curriculum bundle includes a variety of activities, assessments, games, group activities, projects, inquiry lessons, guided notes, and more for teaching Algebra I CCSS standards. The activities are centered on discovery learning and engaging activities with real world connections. Lessons helpPrice $225.00Original Price $445.21Save $220.21
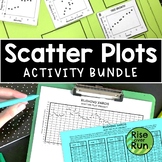
- Engage students in learning about scatter plots with this bundle of activities! The activities and lessons include real world examples to help students see the relevance and importance of scatter plots!Included:Scatter Plot Experiment ActivityScatter Plot Practice Sheets (Six Worksheets)Math MeetsPrice $14.00Original Price $20.99Save $6.99
Description
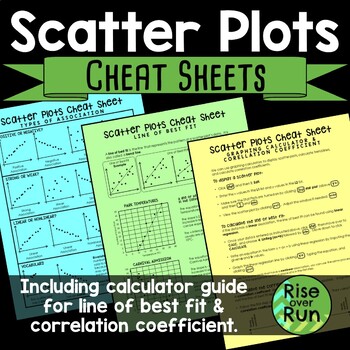
Detailed sheets for the following topics:
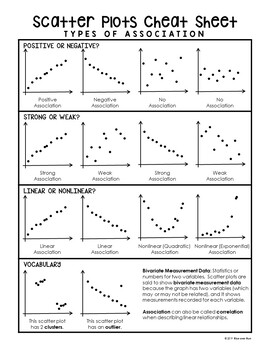
•Types of Association & Vocabulary
This page shows examples of positive, negative, strong, weak, linear, and nonlinear association. It also shows clusters and outliers.
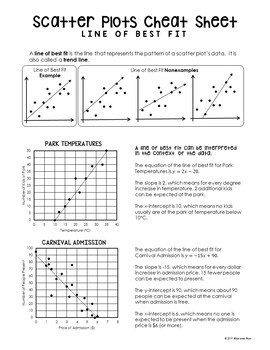
•Line of Best Fit
This page explains what a line of best is (or trend line) along with examples and nonexamples. It has 2 real world connections and how to interpret the line of best fit.
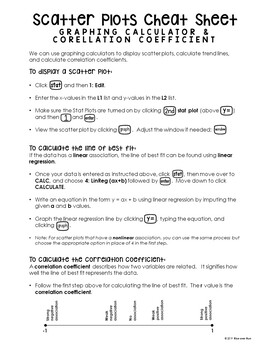
•Graphing Calculator Guide & Correlation Coefficient
This sheet gives step by step instructions for scatter plots, linear regression, and correlation coefficients using technology (specifically TI-84 calculators).
These are great for displaying or as handouts for interactive notebooks and binders.
Total Pages
3 pages
Answer Key
N/A
Teaching Duration
N/A
Report this resource to TPT
Reported resources will be reviewed by our team. Report this resource to let us know if this resource violates TPT’s content guidelines.
Standards
to see state-specific standards (only available in the US).
CCSS8.SP.A.1
Construct and interpret scatter plots for bivariate measurement data to investigate patterns of association between two quantities. Describe patterns such as clustering, outliers, positive or negative association, linear association, and nonlinear association.
CCSS8.SP.A.2
Know that straight lines are widely used to model relationships between two quantitative variables. For scatter plots that suggest a linear association, informally fit a straight line, and informally assess the model fit by judging the closeness of the data points to the line.
CCSS8.SP.A.3
Use the equation of a linear model to solve problems in the context of bivariate measurement data, interpreting the slope and intercept. For example, in a linear model for a biology experiment, interpret a slope of 1.5 cm/hr as meaning that an additional hour of sunlight each day is associated with an additional 1.5 cm in mature plant height.
CCSSHSS-ID.B.6
Represent data on two quantitative variables on a scatter plot, and describe how the variables are related.
CCSSHSS-ID.B.6a
Fit a function to the data; use functions fitted to data to solve problems in the context of the data.

