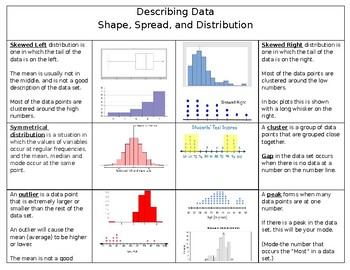
Describing Data based on shape, spread, and distribution
Caroline Palmer
53 Followers
Grade Levels
5th - 9th
Subjects
Resource Type
Formats Included
- PDF
Pages
2 pages
Caroline Palmer
53 Followers
Description
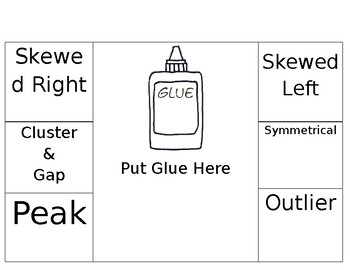
This is a quick foldable already put together for students to use as a reference when describing data based on its shape, spread, and distribution. It goes along with the 6th grade statistics standards.
When printing you should select two sided and print on short edge.
I got the idea from Bailey's corner, but I wanted to make a few changes. Here is the link to her store if you would like to check hers out.
https://www.teacherspayteachers.com/Product/Dot-Plots-and-Describing-the-Shape-of-Data-for-interactive-notebook-1824412
Total Pages
2 pages
Answer Key
N/A
Teaching Duration
N/A
Report this resource to TPT
Reported resources will be reviewed by our team. Report this resource to let us know if this resource violates TPT’s content guidelines.


