Normal Distribution | TI-84 Calculator Reference Sheet and Practice
- PDF
Description
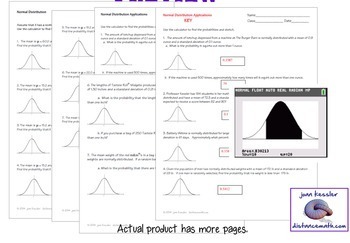
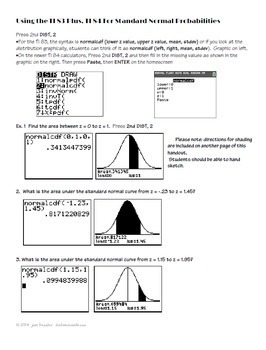
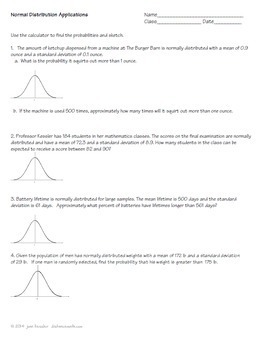
With this Normal Distribution concise, step by step handout, your students will learn how to use the TI 83 and TI 84 Graphing Calculators to find probabilities for the Standard Normal Distribution and also find probabilities for Applications to the Standard Normal Distribution. They will also learn how to use the shade feature to construct a graph and have the calculator shade in the appropriate region.
These can be used as Binder Notes or printed smaller for Interactive Notebooks.
Note: This handout does not include invNorm or problems using that command.
Included:
- Full easy to follow step by step directions with graphics showing each and every step for both the TI 83 and the TI 84.
- Six examples fully done out for the Standard Normal Distribution.
- Four more examples fully done out using interesting applications.
- Two additional examples showing the shade feature with step by step directions with unique easy settings not found elsewhere.
- A 7 problem worksheet for the Standard Normal Distribution.
- 12 fun problems on a worksheet for the applications of the Normal Distribution
- All Answer Keys
You can easily print the instructional handout two to a page from the PDF for a perfect size for Interactive notebooks.
This resource is included in: Mega Bundle of 28 Graphing Calculator Handouts
____________________________________________________________
You may also like:
★ The Normal Distribution Flip Book Foldable
★ Interactive Normal Distribution App with free software
★ Normal Distribution Applications with GOOGLE Slides
★ Measures of Central Tendency, Mean, Median, Mode Flip Book
★ Finding the Standard Deviation Organizers and much more
★ Permutations and Combinations Task Cards QR
★ Linear Regression on the TI 83 84
★ TI-83 TI-84 Mega-Bundle of 26 Teaching Learning Handouts
★ Statistics Final Review Study Guide Exam 6 versions
★ More Graphing Calculator and Graphing Technology Resources
_________________________________________________________________
⇒ Click here to become a follower and be the first to hear about my freebies, sales and new products designed to help you teach, save you time, and engage your students. Did you know that you can earn 5% back towards future purchases by leaving feedback? Your feedback is greatly appreciated.
If you have any questions or comments please contact me by email me at: joankessler@distancemath.com.
LICENSING TERMS: The purchase of a license for this resource is for use by one teacher only for his or her students only. No part of this resource is to be shared with colleagues or used by an entire department, school, or district without purchasing the proper number of licenses. Please respect my hard work and do not share.
COPYRIGHT TERMS: ©2020 Joan Kessler (distancemath.com™). This resource may not be uploaded to the internet in any form, including classroom/personal websites or network drives, unless the site is password protected and can only be accessed by students.


