TPT
Total:
$0.00

FBI Most Wanted AP Stat - Analyze Data, Normal Distributions, Linear Regression

Rated 5 out of 5, based on 3 reviews
5.0 (3 ratings)
;
MsDowns Math
31 Followers
Grade Levels
10th - 12th, Homeschool
Subjects
Resource Type
Standards
Formats Included
  • Google Drive™ folder
  • Internet Activities
$8.00
List Price:
$9.00
You Save:
$1.00
Bundle
$8.00
List Price:
$9.00
You Save:
$1.00
Bundle
Share this resource
Report this resource to TPT
MsDowns Math
31 Followers
Includes Google Apps™
This bundle contains one or more resources with Google apps (e.g. docs, slides, etc.).

Products in this Bundle (3)

    Bonus

    AP Statistics First Week of School Activity
    Also included in
    1. This bundle includes complete guided notes, homework, and editable quizzes for the first 3 units of AP Statistics. The bundle also includes three FBI Most Wanted activities to use with the units and an activity to use with students during the first few weeks of school.
      Price $89.42Original Price $99.35Save $9.93

    Description

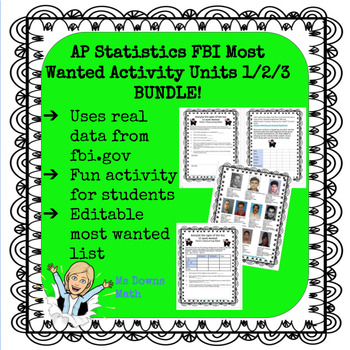
    I have created a series of activities for several units in the AP Statistics curriculum. The students love using data from fbi.gov to review concepts. This activity involves analyzing data related to the top 10 most wanted fugitives. I created this activity in May of 2020 and used the top 10 at that time. In the folder, you will find an editable slide of the top 10 if you want to change it.

    The answer key for the unit is based on the original top 10 that I used. Teachers have the option of having students gather additional data on fugitives. I highly recommend this as the students have a lot of fun with it!

    The topics in this activity are from Unit 1, 2 and 3 of The Practice of Statistics AP edition - analyze qualitative and quantitative data, cumulative relative frequency graphs, linear transformations, z scores, assessing normality, and normal distributions, and linear regression

    In the folder you will find the pdf activities and the editable top 10 most wanted Google slide.

    *** BONUS FILE*** AP Stat first week of school activity!

    As always, an feedback is appreciated. Thank you!

    *** updated 10/2023 with the current top 10 most wanted

    Total Pages
    Answer Key
    N/A
    Teaching Duration
    N/A
    Report this resource to TPT
    Reported resources will be reviewed by our team. Report this resource to let us know if this resource violates TPT’s content guidelines.

    Standards

    to see state-specific standards (only available in the US).
    Represent data with plots on the real number line (dot plots, histograms, and box plots).
    Use statistics appropriate to the shape of the data distribution to compare center (median, mean) and spread (interquartile range, standard deviation) of two or more different data sets.
    Interpret differences in shape, center, and spread in the context of the data sets, accounting for possible effects of extreme data points (outliers).
    Use the mean and standard deviation of a data set to fit it to a normal distribution and to estimate population percentages. Recognize that there are data sets for which such a procedure is not appropriate. Use calculators, spreadsheets, and tables to estimate areas under the normal curve.
    Represent data on two quantitative variables on a scatter plot, and describe how the variables are related.

    Reviews

    Questions & Answers

    31 Followers