191 results
High school statistics independent work packets under $5
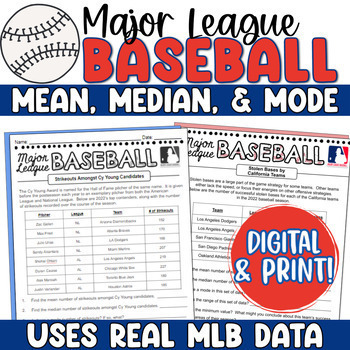
Baseball Math Mean, Median, Mode - MLB Baseball Measures of Central Tendency
This real-world baseball math statistics project asks students to determine mean, median, mode, and range for a variety of actual statistics from the 2023 Major League Baseball season. Perfect to excite any sports enthusiasts! It includes both a traditional print option and a digital version, made for Google for any 1:1 classrooms!Each slide within the activity is dedicated to a different statistic (for example, strikeouts amongst Cy Young candidates, or homeruns amongst MVP candidates). Stud
Subjects:
Grades:
6th - 9th
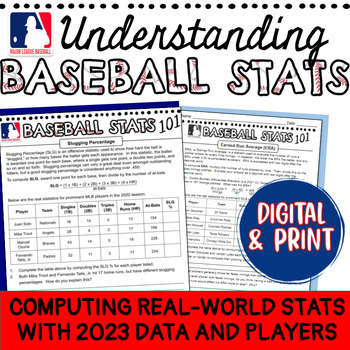
Understanding Baseball Stats MLB Math Sports Statistics Activity Digital & Print
This math baseball statistics activity is perfect for engaging your sports enthusiasts! It includes a Google Slides activity in which students explore and compute different baseball statistics using real numbers from the 2023 season, as well as the traditional print version. Students will enjoy seeing players they know and the real-life stats, and the higher order thinking questions will have them making connections in no time!This activity is great for enrichment, during baseball season, or fo
Subjects:
Grades:
7th - 10th
Types:
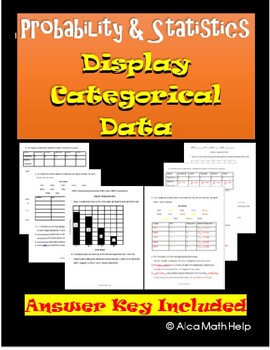
Categorical Data Display Pie Chart & Bar Chart: Worksheet, CW, HW CP & AP Stats
If you are looking for an easy to follow for students. You are at the right place. This is a quick and easy to follow activity sheet that brings across the concept clear and precise. Teachers in my department love this activity sheet. This is useful of CP Probability and Statistics, AP Statistics and Algebra 1 statistics unit. Categorical data and Display Variables ObjectivesAt the end of the lesson students should be able to:1. Correctly define categorical and quantitative data with examples2.
Subjects:
Grades:
8th - 12th, Higher Education, Adult Education, Staff
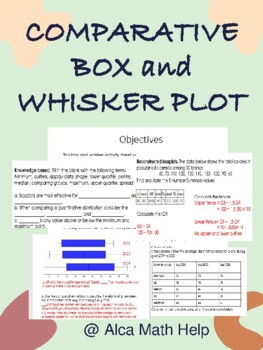
Comparison Box and Whisker Plots Worksheet, Quiz, Test for Stats & AP Stats
This box and whisker activity sheet was designed to test students understanding of the 5 number summary data values given quantitative data sets. Perfect for students in grade 10-12 doing statistics and you want to give them a challenge and should be manageable for students doing AP STATSAt the end of this activity students should be able to1. Students should be able to explain and construct box plots showing the different regions and what they represent. 2. Students should also be able to use
Subjects:
Grades:
11th - 12th, Higher Education, Adult Education, Staff
CCSS:
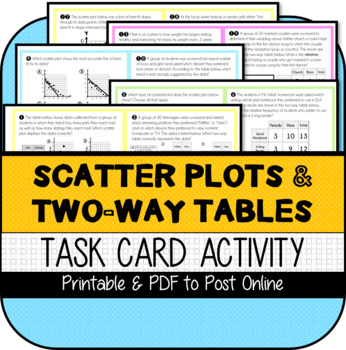
Scatter Plots & Two-Way Tables TASK CARDS
This resource was developed to meet the requirements of the 8th Grade Statistics & Probability Standards below:CCSS.MATH.CONTENT.8.SP.A.1 Construct and interpret scatter plots for bivariate measurement data to investigate patterns of association between two quantities. Describe patterns such as clustering, outliers, positive or negative association, linear association, and nonlinear association.CCSS.MATH.CONTENT.8.SP.A.2 Know that straight lines are widely used to model relationships between
Subjects:
Grades:
7th - 9th
Also included in: Scatter Plots & Two-Way Tables UNIT BUNDLE

MEANS AND VARIANCES OF A RANDOM VARIABLE
Means and Variances of a Random VariableIn this lesson, students will learn:▪ how to apply the rules for sums or differences of means of two separate distributions or repeated trials from a single distribution▪ how to apply the rules for sums or differences of variances of two separate distributions or repeated trials from a single distribution
Subjects:
Grades:
10th - 12th, Higher Education
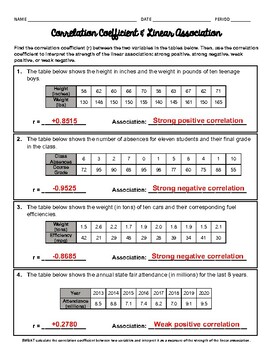
Correlation Coefficient and Linear Association Worksheet
8 question worksheet on using technology to find the correlation coefficient, and use it to determine the strength of a linear association (strong positive, strong negative, weak positive, or weak negative). #1 - 8 given a table in context of real-world problems, use technology to find the correlation coefficient (r) between the two variables. Then use r to determine the strength of the linear association. Answer key included.VISIT US AT WWW.ALMIGHTYALGEBRA.COM FOR MORE RESOURCES AND BUNDLED DIS
Subjects:
Grades:
8th - 12th
CCSS:
KEY | MEANS AND VARIANCES OF A RANDOM SAMPLE
Means and Variances of a Random VariableIn this lesson, students will learn:▪ how to apply the rules for sums or differences of means of two separate distributions or repeated trials from a single distribution▪ how to apply the rules for sums or differences of variances of two separate distributions or repeated trials from a single distribution
Subjects:
Grades:
10th - 12th, Higher Education
KEY | How Does Stratifying Improve on a Simple Random Sample?
How Does Stratifying Improve on a Simple Random Sample? In this lesson, students will learn:what is meant by an unbiased estimator or statistichow to simulate a simple random samplehow to simulate a sample proportionhow to simulate a stratified random sample.the difference between bias and variation.
Subjects:
Grades:
10th - 12th, Higher Education
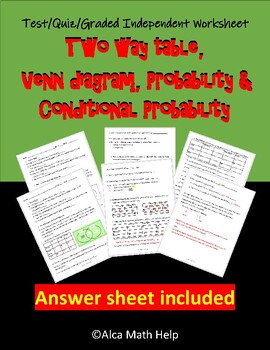
Unit Test/Quiz/Packet- Two-way table, Venn diagram, Conditional Probability
If you are looking for an easy to follow for students. You are at the right place. This is a quick and easy to follow activity sheet that brings across the concept clearly and precisely. Teachers in my department love this activity sheet. This is useful for CP Probability and Statistics, AP Statistics and Algebra 1 statistics unit.5W’s and How of statisticsAt the end of the lesson students should be able to:1. Recall the history of statistics2. Define the 5W’s and How of statistics with example
Subjects:
Grades:
9th - 12th, Higher Education, Adult Education, Staff
CCSS:

ARE ALTITUDE AND PRECIPITATION INDEPENDENT?
In this lesson, students will learn:to create and interpret a two-way tableto calculate "or" probabilities, "and" probabilities, or conditional probabilities— the "given" type, by reading a two-way table, or by applying one of the basic probability formulas.to viscerally decide if two events are independent--viscerally because they have not yet learned the Chi-square test of independence.
Subjects:
Grades:
10th - 12th, Higher Education

Do Heavier Cars Use More Gasoline?
In this lesson, students will learn:to create a scatterplot and a linear regression line on a graphing calculator.to assess how linear the data points are and how useful a linear regression will be.to create and interpret a residual plot.to make predictions using the regression line, distinguishing between extrapolations and interpolation
Subjects:
Grades:
10th - 12th, Higher Education

How Much TV Do College Students Watch?
In this lesson, students will learn:how to perform all the steps of a confidence intervalhow to perform all the steps of a significance testhow to predict the outcome of a two-tailed significance test by using the corresponding confidence interval
Subjects:
Grades:
10th - 12th, Higher Education
How Does Stratifying Improve on a Simple Random Sample?
How Does Stratifying Improve on a Simple Random Sample?In this lesson, students will learn:what is meant by an unbiased estimator or statistichow to simulate a simple random samplehow to simulate a sample proportionhow to simulate a stratified random sample.the difference between bias and variation.
Subjects:
Grades:
10th - 12th, Higher Education

KEY | Do Heavier Cars Use More Gasoline?
In this lesson, students will learn:to create a scatterplot and a linear regression line on a graphing calculator.to assess how linear the data points are and how useful a linear regression will be.to create and interpret a residual plot.to make predictions using the regression line, distinguishing between extrapolations and interpolation
Subjects:
Grades:
10th - 12th, Higher Education

KEY | ARE ALTITUDE AND PRECIPITATION INDEPENDENT?
In this lesson, students will learn:to create and interpret a two-way tableto calculate "or" probabilities, "and" probabilities, or conditional probabilities— the "given" type, by reading a two-way table, or by applying one of the basic probability formulas.to viscerally decide if two events are independent--viscerally because they have not yet learned the Chi-square test of independence.
Subjects:
Grades:
10th - 12th, Higher Education
Data and Statistics Review: Measures of Center, Dot and Box Plots, and More
This Data and Statistics Review Packet is perfect for Statistics students or anyone doing SAT Math prep. Included Types of Data Representations:Distance vs. time graphBar graphDouble bar graphLine graphBoxplotScatterplot with and without a best fit lineDot plotThis is the figure and graph analysis chapter from my book "Overcoming Digital SAT Math" by Sophia Garcia. It contains 45 mostly SAT-style math questions. Bundle and save by getting my entire Digital SAT Math Workbook or just get my SAT ma
Subjects:
Grades:
9th - 12th
Also included in: SAT Math Prep Workbook for Digital SAT

KEY | How Much T.V. Do College Students Watch?
In this lesson, students will learn:how to perform all the steps of a confidence intervalhow to perform all the steps of a significance testhow to predict the outcome of a two-tailed significance test by using the corresponding confidence interval
Subjects:
Grades:
10th - 12th, Higher Education
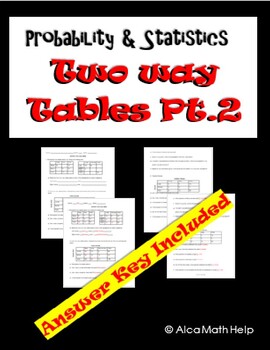
Probability & Statistics- Two-Way Table Worksheet, Homework, Quiz, AP Review
If you are looking for an easy to follow for students. You are at the right place. This is a quick and easy to follow activity sheet that brings across the concept clearly and precisely. Teachers in my department love this activity sheet and the students enjoy it. This is useful for CP Probability and Statistics, AP Statistics and Algebra 1 Statistics unitAt the end of the lesson students should be able to:1. Define two-way tables with its properties.2. Create two- way tables using frequency co
Subjects:
Grades:
9th - 12th, Higher Education, Adult Education, Staff
CCSS:
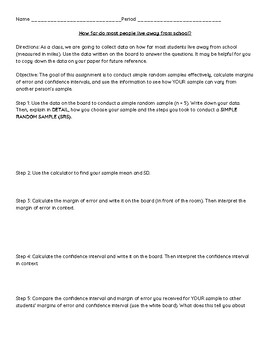
Margin of Error and Confidence Intervals Class Activity: Statistics
Hi! If you're looking for an interactive class activity on margin of error and confidence intervals, this is a fun and engaging 1-2 hour long activity you can do with your student. It will require students to collect data and use the data to create their own confidence intervals. Feel free to edit the document as you need. I've used this assignment as an open quiz/class quiz and/or exit ticket before. Please do not distribute or post this resource publicly. Thank you!
Subjects:
Grades:
10th - 12th
CCSS:
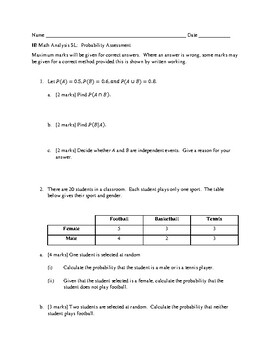
IB Math AA SL: Probability Assessment with Answer Key
This 37-mark, 6-question assessment contains Paper 1 style probability questions asking students to:determine whether events are independentfind the union/intersection of two events use a two-way table to find probabilities, including conditional probabilityfind the probability of two independent eventsfind probabilities of mutually exclusive eventsdraw a tree diagram and use the diagram to calculate probabilities
Subjects:
Grades:
11th - 12th
CCSS:
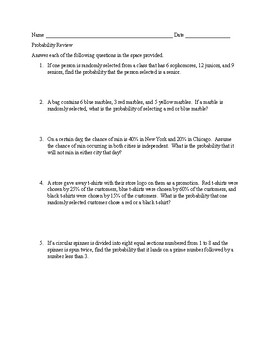
Probability Review with Answer Key
This 22-question packet contains questions for mutually exclusive/inclusive events, complementary events, independent events, permutations and combinations, and conditional probability. The questions are mixed up so students have to determine whether they need to multiply, use the addition rule, use the conditional probability formula, or use their calculator to figure out a permutation or combination.I use this assignment as a review in my lower level Prob & Stats class.
Subjects:
Grades:
10th - 12th, Higher Education
CCSS:
Also included in: Probability Bundle - PowerPoint, HW, Quizzes with Answer Keys
The 5W's & How of Statistics Worksheet, CP Stats, AP Stats, HW, Back-to-School
If you are looking for an easy to follow for students. You are at the right place. This is a quick and easy to follow activity sheet that brings across the concept clearly and precisely. Teachers in my department love this activity sheet. This is useful for CP Probability and Statistics, AP Statistics and Algebra 1 statistics unit.5W’s and How ObjectivesAt the end of the lesson students should be able to:1. Recall the history of statistics2. Define the 5W’s and How of statistics with examples3.
Subjects:
Grades:
8th - 12th, Higher Education, Adult Education, Staff
CCSS:
IB Math AA SL: Probability Assessment
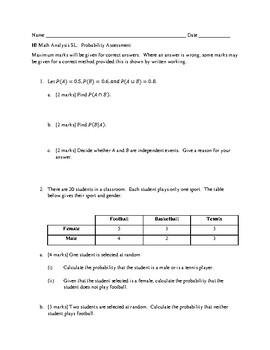
This 37-mark, 6-question assessment contains Paper 1 style probability questions asking students to:determine whether events are independentfind the union/intersection of two events use a two-way table to find probabilities, including conditional probabilityfind the probability of two independent eventsfind probabilities of mutually exclusive eventsdraw a tree diagram and use the diagram to calculate probabilitiesIf you would like to purchase this resource with the answer key attached, try:IB Ma
Subjects:
Grades:
11th - 12th
CCSS:
Showing 1-24 of 191 results


