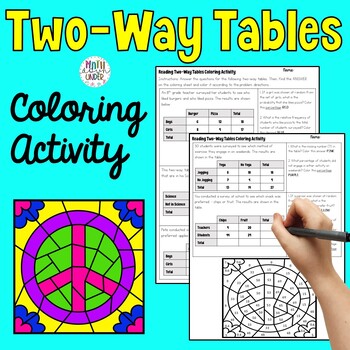
Two-Way Tables and Relative Frequency Coloring Activity
Math Down Under
914 Followers
Grade Levels
8th - 9th
Subjects
Resource Type
Standards
CCSS8.SP.A.4
Formats Included
- PDF
Pages
2 pages
Math Down Under
914 Followers
Also included in
- Grab a bargain with this bundle of 3 activities for practicing creating and interpreting two-way tables! Included:1. Constructing Two-Way Tables Practice Pages - PDF & Digital2. Interpreting Two-Way Tables Coloring Activity - find the percentage and relative frequencies3. Two-Way Table 'Find thPrice $6.50Original Price $9.00Save $2.50
- This bundle includes different activities to supplement your 8th grade Data & Statistic Unit (Creating Scatter Plots, Interpreting Scatter Plots, Line of Best Fit, Equation of the Line, Constructing & Interpreting Two-Way Frequency Tables)More than a worksheet! Task Cards, Find the Traitor MPrice $16.00Original Price $23.50Save $7.50
Description
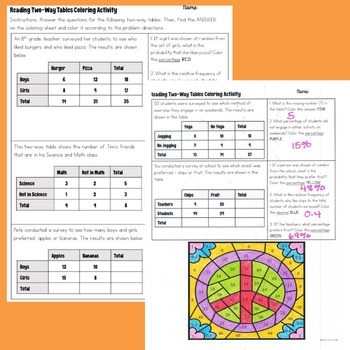
Your students will love practicing reading and interpreting two-way frequency tables in this fun, color by number activity! 13 problems to solve and a peace sign mosaic to color according to the question instructions. Perfect for your Data & Statistic Unit! The entire product is viewable in the preview file. Please follow my store and thank you for your support!
Great for:
- Review
- Math Centers
- Choice Boards
- Homework
- Early finishers
Total Pages
2 pages
Answer Key
Included
Teaching Duration
N/A
Report this resource to TPT
Reported resources will be reviewed by our team. Report this resource to let us know if this resource violates TPT’s content guidelines.
Standards
to see state-specific standards (only available in the US).
CCSS8.SP.A.4
Understand that patterns of association can also be seen in bivariate categorical data by displaying frequencies and relative frequencies in a two-way table. Construct and interpret a two-way table summarizing data on two categorical variables collected from the same subjects. Use relative frequencies calculated for rows or columns to describe possible association between the two variables. For example, collect data from students in your class on whether or not they have a curfew on school nights and whether or not they have assigned chores at home. Is there evidence that those who have a curfew also tend to have chores?


