
FBI Most Wanted AP Statistics, Modeling Data, Z scores and Normal Distributions

- Google Drive™ folder

What educators are saying
Also included in
 I have created a series of activities for several units in the AP Statistics curriculum. The students love using data from fbi.gov to review concepts. This activity involves analyzing data related to the top 10 most wanted fugitives. I created this activity in May of 2020 and used the top 10 at thatPrice $8.00Original Price $9.00Save $1.00
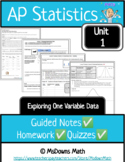 Unit 1 - Exploring One Variable DataThis unit follows the College Board curriculum for AP statistics. Included are guided notes and homework for students as well as answer keys and editable quizzes (2 quizzes for this unit). ✔ Each guided notes lesson include vocabulary, tips, and examples.✔ EachPrice $35.51Original Price $39.45Save $3.94
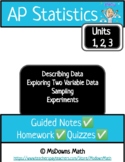 This bundle includes complete guided notes, homework, and editable quizzes for the first 3 units of AP Statistics. The bundle also includes three FBI Most Wanted activities to use with the units and an activity to use with students during the first few weeks of school.Price $89.42Original Price $99.35Save $9.93
Description
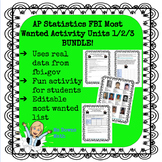
I created a series of activities for several units in the AP Statistics curriculum. The students love using data from fbi.gov to review concepts. This activity involves analyzing data related to the top 10 most wanted fugitives. I created this activity in May of 2020 and used the top 10 at that time. In the folder, you will find an editable slide of the top 10 if you want to change it.
The answer key for the unit is based on the original top 10 that I used. Teachers have the option of having students gather additional data on fugitives. I highly recommend this as the students have a lot of fun with it!
The topics in this activity are from Unit 2 of The Practice of Statistics AP edition - cumulative relative frequency graphs, linear transformations, z scores, assessing normality, and normal distributions.
In the folder you will find the pdf activity and the editable top 10 most wanted Google slide.
As always, an feedback is appreciated. Thank you!
** Updated 10/2023 with current top 10 most wanted fugitves
