
Data Analysis and Statistics FOLDABLES™ (Algebra 2 - Unit 13)

- Zip
Also included in
 ALGEBRA 2 CURRICULUM BIG BUNDLE What does the curriculum include?This resource is designed for students enrolled in ALGEBRA 2 HONORS. You will find more than 1900+ pages of instructional content (warm-ups, notes, foldables, Google Slides, video lessons, homework, daily lesson quizzes, mid-unit and ePrice $460.00Original Price $576.73Save $116.73
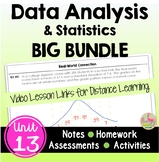 This is a BIG Bundle of GUIDED NOTES WITH GOOGLE SLIDES and VIDEO LESSONS for your distance learning needs, homework, daily warm-up, content quizzes, mid-unit and end-unit assessments, review assignments, and cooperative activities for Algebra 2 Honors UNIT 13: DATA ANALYSIS & STATISTICS. #distaPrice $28.40Original Price $38.50Save $10.10
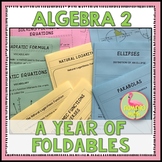 Here is my FULL YEAR OF ALGEBRA 2 LESSONS IN 82 FOLDABLES™ for students enrolled in ALGEBRA 2 HONORS. The lessons are rigorous and engaging. BOUND-BOOK STYLE FOLDABLES™:Each lesson is presented with an 8-page Bound-Book style Foldable™, (sometimes a 12-page Foldable) inspired by the work of Dinah ZiPrice $99.60Original Price $124.50Save $24.90
Description
This bundle of 8-page Bound-Book-Style Foldables includes six lessons on topics in UNIT 13: Data Analysis & Statistics for your Algebra 2 Honors students. A set of finished notes and directions for creating the Foldables are also included.
⭐ Bonus: A set of Google Slides for presenting the lesson and video lesson links are now included for distance learning and flipped classroom methods.
☆FOLDABLES
Three options of an 8-page Bound-Book Foldable® will help with differentiation.
Option #1: All vocabulary, formulas, and theorems are included. Students work through examples while you teach.
Option #2: A completed set of the lesson can be copied for absent students or students with an IEP that need this option.
Option #3: An editable PowerPoint version with no information or examples for you to design your own, only the headings for the lesson topics on each page. You add the examples and images desired.
☆ Keys and Directions for assembly of the foldable.
These foldabes are inspired by the work of Dinah Zike, and is used by permission.
************************************************************************************************************
⭐For updates about sales and new products, please follow my store: My TpT Store
You can also
⭐Subscribe to my newsletter for freebies and teaching tips
⭐Follow me on Instagram
⭐Check out my Facebook page
⭐Follow me on Pinterest
I value your feedback. Please rate this product. If you have any issues or questions about this product, please feel free to ask a question in my store or write to me at jean@flamingomath.com
Thanks for shopping in my store!
Jean Adams
