1,558 results
High school statistics internet activities for Microsoft PowerPoint
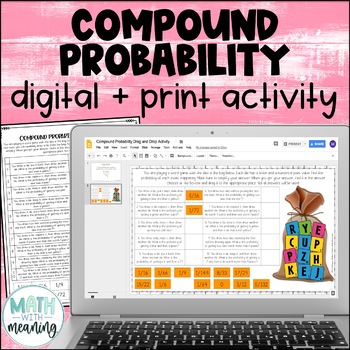
Compound Probability Digital and Print Activity for Google Drive and OneDrive
Looking for an engaging, no-prep activity to practice finding the probability of compound events? Students will use the included image to find the probability of 10 compound events, including both independent and dependent events. They will then find their answer from the answer choices at the bottom and drag it to the appropriate spot. Please view the preview file to make sure that this activity is appropriate for your students.This product includes the following:A link to the digital activity
Subjects:
Grades:
6th - 9th
CCSS:
Also included in: Middle School Math Digital and Print Activity Bundle Volume 1
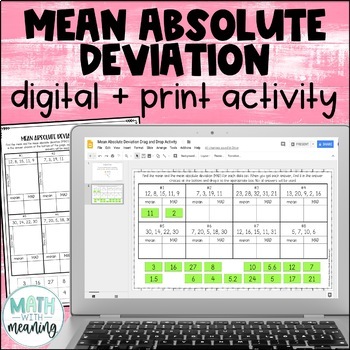
Mean Absolute Deviation MAD Digital and Print Activity for Google Drive
Looking for an engaging, no-prep activity to practice finding the MAD? Students will find the mean and mean absolute deviation for 8 data sets. They will then then find their answer from the answer choices at the bottom and drag it to the appropriate spot. Each data set contains 4-5 numbers. The mean of each data set is a whole number. Please view the preview file to make sure that these types of problems are appropriate for your students.This product includes the following:A link to the activit
Subjects:
Grades:
6th - 9th
CCSS:
Also included in: Middle School Math Digital and Print Activity Bundle Volume 2
Statistics Project - Statistics Olympics
Engage your students in their study of statistics as they compete in self-created Olympic style events. This project will engage students and help them discover meaning and apply concepts including measures of central tendency, quartiles, outliers, variance, standard deviation, z-scores, box plots, histograms, normal and skewed distributions. This project can be completed in approximately 6-8 days (50-min class periods) ** March 2023 Update **Visual updates to all slides and documentsRubric ali
Subjects:
Grades:
6th - 12th
CCSS:
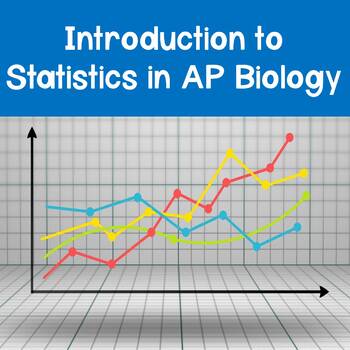
AP Biology Introduction to Statistics PowerPoint
The AP Biology* exam has been updated for the 2019-2020 school year. You can find the updated course description guide here. Make sure that you and your students are prepared for these changes. Save countless hours of research aligning your content to the new AP Biology* course outline by purchasing this resource. This resource includes everything your students need to know to master statistics related to AP Biology*.Included in this PowerPoint for the Introduction to Statistics in AP Biology* a
Subjects:
Grades:
9th - 12th
Types:
Also included in: AP Biology PowerPoints- FULL YEAR Bundle- Distance Learning Compatible
Descriptive Statistics- Guided Notes, Presentation, and INB Activities
This Introduction to Statistics product is flexible, editable, and can be used for in-person or distance learning. Take the time and stress out of creating your own guided notes and presentations. There are many ways to use this engaging bundle. It includes guided notes embedded with student practice problems (keys included), foldable activities, and a PowerPoint presentation for focused instruction. Choose what works best for your class/student and modify to make the content fit your needs. Not
Subjects:
Grades:
9th - 12th
CCSS:
Also included in: Custom Bundle for Viet
Introduction to Statistics - Guided Notes, Presentation, and INB Activities
This Introduction to Statistics product is flexible, editable, and can be used for in-person or distance learning. Take the time and stress out of creating your own guided notes and presentations. There are many ways to use this engaging bundle. It includes guided notes embedded with student practice problems (keys included), foldable activities, and a PowerPoint presentation for focused instruction. Choose what works best for your class/student and modify to make the content fit your needs. Not
Subjects:
Grades:
9th - 12th
CCSS:
Also included in: Custom Bundle for Viet
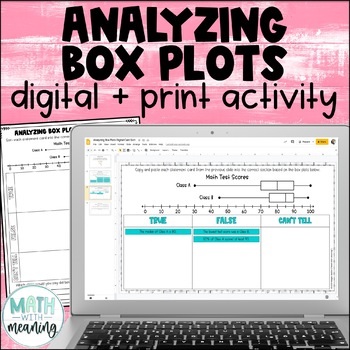
Box and Whisker Plot Digital and Print Card Sort - Reading and Analyzing
Looking for an engaging, no-prep activity to practice reading and analyzing box plots? Students will look at a double box plot and determine if statements about it are true, false, or if they can't tell from the information given in this fun digital and print activity.This activity includes statements about the minimum, maximum, median, quartile 1 (Q1), quartile 3 (Q3), interquartile range (IQR), and range of the box plots, along with statements about the percentages represented by a particular
Subjects:
Grades:
6th - 9th
Also included in: Middle School Math Digital and Print Activity Bundle Volume 3
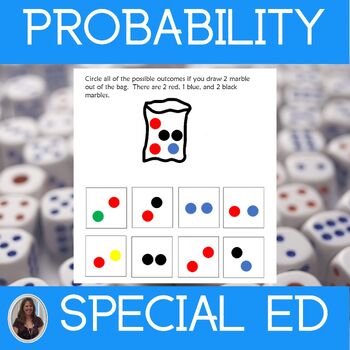
Chance & Probability Math Worksheets Special Education Statistics & Probability
This unit on Chance and Probability contains printable and digital math worksheets for special education. This statistics and probability unit is for students who take alternate assessments.This Chance and Probability unit helps students understand how to determine the probability of an event and all its possible outcomes. The worksheets, which use pictures and color coding, are differentiated. There are many ways for students to practice these skills in this unit that are at different levels.
Subjects:
Grades:
7th - 9th
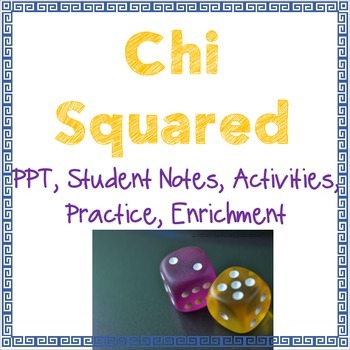
Chi Squared
Chi SquaredTeaching Chi Squared to a Stats class or AP Bio and not sure where to start?! Well, you found it. I created this product for my husband, who teaching AP Biology. This pack includes a PPT introduction, complete with student fill-in-the-blank notes, that walk students through the steps of Chi Squared and gives them a general overview of how and why we use this test. Degrees of Freedom are explained, as well as p-value. Notes provide an additional practice problem to do as a class. This
Subjects:
Grades:
9th - 12th
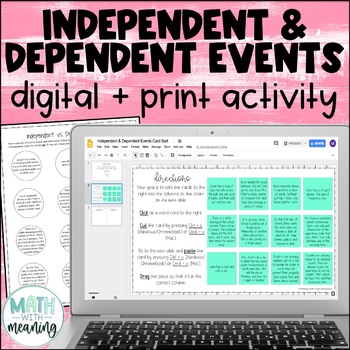
Independent and Dependent Events Digital Print Card Sort - Compound Probability
Looking for an engaging, no-prep activity to practice identifying independent and dependent events? Students will read 12 sets of compound events and determine if they are independent or dependent events. Many examples of real-world events are included. This is a great activity for students learning compound probability who struggle with differentiating between independent and dependent events. Also included is a printable graphic organizer that is perfectly sized for interactive notebooks. Plea
Subjects:
Grades:
6th - 9th
CCSS:
Also included in: Middle School Math Digital and Print Activity Bundle Volume 2
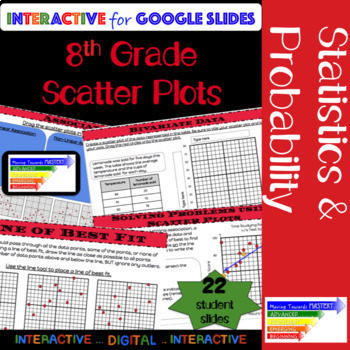
8th Grade Math Scatter Plot: Guided Interactive Lesson
Extensive ALL digital guided lesson for constructing and interpreting scatter plots.The slides are scaffolded to build understanding. Students will progress from identification of terms to making predictions involving bivariate data. The guided slides will begin with identification, move towards assisted analysis, and conclude with independent practice.Slides include...♦ Definitions and Visual Representations♦ Identification and Use of Terms→ Bivariate Data→ Scatter Plot→ Linear, Nonlinear, &
Subjects:
Grades:
8th - 10th
Types:
CCSS:
Also included in: 8th Grade Math Common Core Growing Bundle
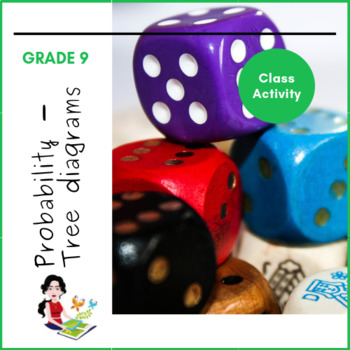
Probability - Tree Diagrams for independent and dependent events
To save you some time when you are preparing your lessons on dependent and independent events, I have collected a bunch of problems that can be solve by drawing tree diagrams and made a slide show of the questions and there answers. The tree diagrams are animated to enable you to explain as you go on. They can also be adjusted very easily and quickly to fit any other problems that you want you learners to solve.There are 6 examples of dependent events and 9 of independent events. I have also inc
Subjects:
Grades:
7th - 12th
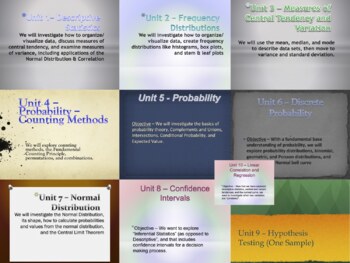
A Mountain of Statistics Curriculum - One Full Year Bundle
This is a bundle of 10 Units, Midterm Exam, & Final Exam designed for a high school Statistics Class (can be applied to University discipline). Each unit plan includes Common Core Standards, Key Concepts/Enduring Understandings, Essential Questions/Do Now, Activities, Resources, Procedures, and Assessment techniques. It is designed to be a lifelong tool that you can add to, edit, and re-use every year! Please see each Unit Statistics Product in the MountainWorks Store (sold separately) for
Subjects:
Grades:
9th - 12th, Higher Education
Statistics Curriculum Statistics and Probability Special Ed Math Curriculum
Save $$$ with this Statistics Curriculum. This special ed math curriculum contains 8 units from my series on statistics including statistics and probability. They were developed for students with autism and special learning needs in middle and high school. Each unit is structured in the same way with similar content to enable your students to make connections and build on what they learn in each unit. This repetition of format helps ease anxiety and free up mental space when learning more di
Subjects:
Grades:
8th - 10th
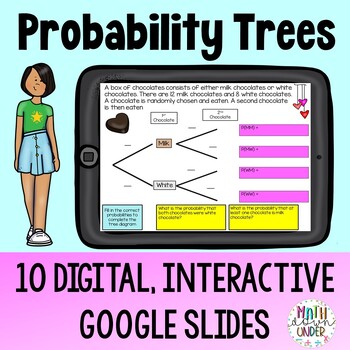
Probability Tree Diagrams Practice - Digital Activity using Google Slides
This resource is a set of 10 Google Slides that practices Probability Tree Diagrams. Complete with attractive graphics, students will solve compound probability problems (independent and dependent events included) by filling in the missing spaces on a probability tree. Starting with structured scaffolding, students are introduced to the process of creating probability trees by clicking and filling in the blanks on the Google Slide. This approach builds confidence and ensures students grasp the f
Subjects:
Grades:
6th - 9th
Also included in: Probability Tree Practice Bundle - PDF & Digital
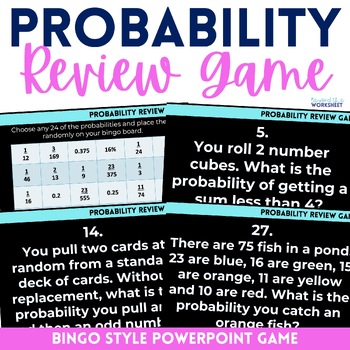
Probability PowerPoint Review Math Game
⭐️ This probability game is a fun way for students to practice or review probability skills. Included are basic and compound probability questions. ⭐️ Students must choose 24 of 30 probabilities to include on their Bingo card. The PowerPoint includes 30 questions for them to solve in order to play Bingo. ⭐️ Included in the file is the PowerPoint, Bingo Card and Answer sheet. Available in the following bundle: 7th Grade Curriculum Resources Mega BundleLicensing Terms:By purchasing this product, y
Subjects:
Grades:
7th - 9th
Also included in: 7th Grade Math Curriculum Supplemental Activities Bundle
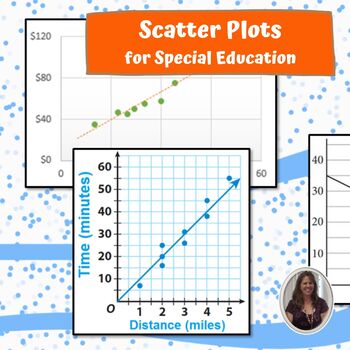
Scatter Plots for Special Education PRINT AND DIGITAL
This unit on Scatter Plots has almost 200 pages and 72 slides of material specifically designed for students with special learning needs, especially autism who are in middle and high school. This unit focuses on helping students interpret and read scatter plots. There are differentiated versions of the worksheets that use pictures and color coding. There are many, many worksheet for students to practice in this unit that are at different levels. There are MANY opportunities for students to e
Subjects:
Grades:
8th - 10th
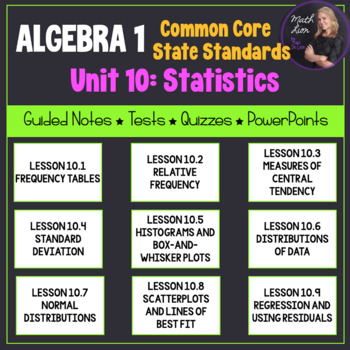
Statistics (Algebra 1 Curriculum - Unit 10) | Bundle for Common Core
This is a great unit that covers a Statistics unit in an Algebra 1 course! 9 lessons are included!All documents are EDITABLE!Included:- Overview of the common core alignment (PDF)- Guided notes for 9 lessons (PDF and Word)- PowerPoints that coordinate with the guided notes (PPTX)- Mid-Unit Quiz (PDF and Word)- Unit Test (PDF and Word)-Pacing Guide (PDF and Word)Each lesson contains a learning scale, warm up (do-now or bell ringer), key concepts, vocabulary, and examples for students to follow w
Subjects:
Grades:
7th - 12th
CCSS:
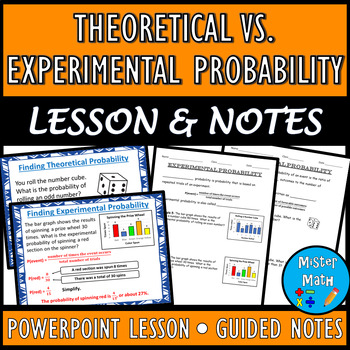
Theoretical vs. Experimental Probability PPT & Guided Notes BUNDLE
This BUNDLE includes a PowerPoint Lesson and a corresponding Guided Notes Packet to assist students in learning about theoretical and experimental probability. Students will learn the concepts of theoretical and experimental probability, as well as how to find the probabilities of each. Plenty of real-life examples are included to give students ample opportunities to practice the skills. Overall, the 21-slide PowerPoint and 6-page guided notes packet covers the following topics:Theoretical Proba
Subjects:
Grades:
6th - 9th
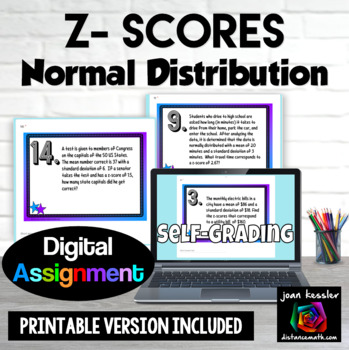
Normal Distribution Z-Scores Digital plus Print
Your students will get extra practice and gain fluency learning about z-scores and the Normal Distribution with both a self-grading digital resource and a PDF printable version. There are 16 applications to solve with a mix of multiple choice and free response including: finding the z-scorefinding the standard deviation knowing the z-score, mean, and data point finding the mean knowing the z-score, data point, and standard deviationinterpreting the z-score. Your download includes:PDF with link
Subjects:
Grades:
9th - 12th
Types:
CCSS:
Also included in: Probability and Statistics Algebra 2 Unit 11 Activity Bundle

Measures of Center and Spread |Mean, Median, Standard Deviation, +|Google Forms™
Included in this Product: 100% Self-Grading Assessment or Homework using Google Forms™ - Measures of Center and Spread - Mean, Median, Range, Interquartile Range, Standard Deviation - 26 Questions each (9 multiple choice, 15 free response, and 2 checkbox). The default multiple choice answer order is generally set to be "shuffled" to prevent cheating. However, this can be edited. 2 similar versions for the price of 1!! Having a second version of the form allows for retakes and also gives you opt
Subjects:
Grades:
8th - 12th
Types:
CCSS:
Also included in: Algebra 2 Google Forms™
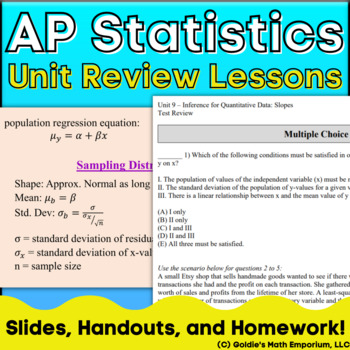
Goldie's AP® Statistics Review Lessons and Homework
AP StatisticsUnit Review Lessons and Homework Assignments You can use these resources:throughout your year in AP Statistics, as a way to review before quizzes and testsas end of the year AP Exam reviewas an independent study guide resource for students Note: These resources are included in their respective unit plans. You get a total of 21 individual resources in this amazing bundle. There are 9 units in the AP Statistics course, and each unit comes with the following:PowerPoint presentation rev
Subjects:
Grades:
11th - 12th
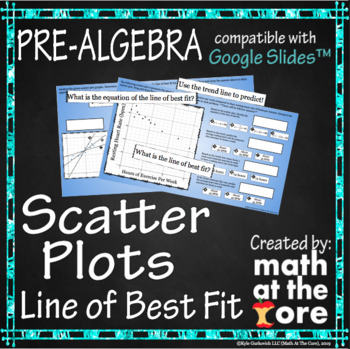
Scatter Plots - Line of Best Fit for Google Slides™
- Great for online and distance learning! Created to be compatible with Google Slides™!- In this digital activity, students will analyze scatter plots and determine the line of best fit. They will use the line of best fit and the equation of that line to predict values. They should be familiar with writing the equation of a line.- This activity includes 20 different problems involving analyzing scatter plots. Students will start with determining which line is the line of best fit for the given s
Subjects:
Grades:
7th - 9th
Types:
Also included in: Statistics - Unit 7 - BUNDLE for Google Slides™
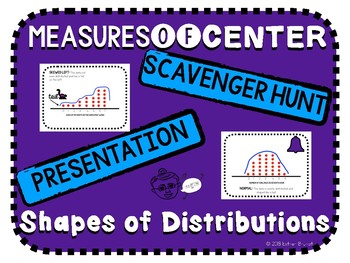
Shapes of Distributions and Measures of Center Scavenger Hunt and Presentation
A note to the teacherThis resource is for teaching shapes of distributions, analyzing the use of the mean versus the median, and deciphering which among the two is higher based on the shape of the distribution.This resource includes:Keynote and Powerpoint Presentation & PDF(Animated)Shapes of DistributionsNormalSkewed LeftSkewed Rigt2 Examples EachWhich Measure of Center is More Appropriate (Mean vs Median)6 Example Knowledge Check Which Measure of Center is Higher (Mean vs Median)?6 Example
Subjects:
Grades:
8th - 12th
Also included in: Math Activity Bundle
Showing 1-24 of 1,558 results


