
Statistics (Algebra 1 Curriculum - Unit 10) | Bundle for Common Core


- Zip
Also included in
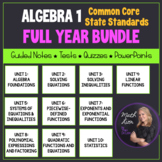 This is a great bundle that covers concepts for a full year Algebra 1 course! 76 lessons are included! Documents are EDITABLE!Included:- Overview of the common core alignment tandards (Two 18-week guides) (PDF and Word) - Overview of the common core alignment (PDF)- Guided notes for 76 lessons (PPrice $80.00Original Price $100.00Save $20.00
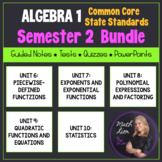 This is a great bundle that covers concepts for the second semester of an Algebra 1 course!Included:- Pacing guides with common core state standards (18-week guide) (PDF and Word)- Overview of the common core alignment (PDF)- Guided notes for 39 lessons (PDF and Word)- PowerPoint presentations (aligPrice $45.00Original Price $50.00Save $5.00
Description
This is a great unit that covers a Statistics unit in an Algebra 1 course! 9 lessons are included!
All documents are EDITABLE!
Included:
- Overview of the common core alignment (PDF)
- Guided notes for 9 lessons (PDF and Word)
- PowerPoints that coordinate with the guided notes (PPTX)
- Mid-Unit Quiz (PDF and Word)
- Unit Test (PDF and Word)
-Pacing Guide (PDF and Word)
Each lesson contains a learning scale, warm up (do-now or bell ringer), key concepts, vocabulary, and examples for students to follow with their guided notes. Each lesson is aligned with the common core state standards. The lessons are 30 - 45 minutes each.
Topics included are:
Frequency Tables
Relative Frequency
Measures of Central Tendency
Standard Deviation
Histograms and Box-and-Whisker Plots
Distributions of Data
Normal Distributions
Scatterplots and Lines of Best Fit
Regression and Using Residuals
Unit Essential Questions:
How can you describe and compare data sets?
How can you describe the relationship between two variables and use it to make predictions?
