28 results
High school statistics centers for Microsoft PowerPoint
Probability project using Real-World March Madness Tournament
Jump into the March Madness tournament to apply probability concepts to a real-world application. Great for your sports-loving students. Students explore probability first by determining the probability that a team will win. Students, further, weight teams based on historical data and/or team statistics. This mini-project allows for creative problem-solving and has some open-ended answers.Included in this resource:★ Student pages for 3 March Madness related activities★ Detailed guidelines fo
Subjects:
Grades:
7th - 10th
Types:
Also included in: 7th Grade Math Resource Bundle
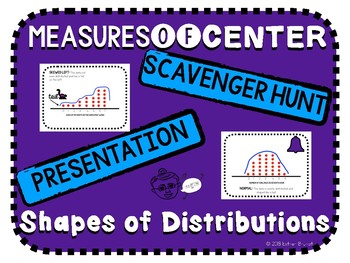
Shapes of Distributions and Measures of Center Scavenger Hunt and Presentation
A note to the teacherThis resource is for teaching shapes of distributions, analyzing the use of the mean versus the median, and deciphering which among the two is higher based on the shape of the distribution.This resource includes:Keynote and Powerpoint Presentation & PDF(Animated)Shapes of DistributionsNormalSkewed LeftSkewed Rigt2 Examples EachWhich Measure of Center is More Appropriate (Mean vs Median)6 Example Knowledge Check Which Measure of Center is Higher (Mean vs Median)?6 Example
Subjects:
Grades:
8th - 12th
Also included in: Math Activity Bundle
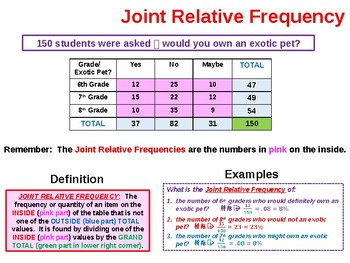
Two Way Frequency Tables Summary
This MS PowerPoint presentation provides background information on 2-Way Frequency Tables as well as the specific steps to follow create and analyze them. It is used to kickoff our study of this subject n my Pre-Algebra and Math I classes. It addresses all of the terms encountered in the construction and use of 2-Way tables including Joint Relative Frequency, Marginal Relative Frequency and Conditional Relative Frequency. It is a totally animated ppt file and very easy for students to underst
Subjects:
Grades:
8th - 10th
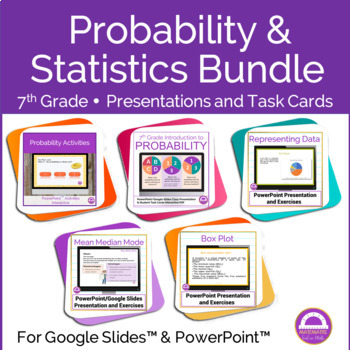
Bundle Statistics and Probability | 50% Discount
PowerPoint presentations on statistics and probalility. Perfect for an online lesson or distance learning.You can send it to your students and they'll have everything they need. If you are online with them, you can project it and comment.Or you can simply print it and give to your students.Suitable for IB MYP Middle Years ProgrammeIt includes:Mean, Mode and Median.With examples and exercises, for students to practice.This product and:Distance Learning - Mean. Mode, Median - Google Slideshttps:/
Subjects:
Grades:
6th - 9th
Math 1 / Algebra 1 Bundle - Unit 9 Statistical Measures and Data Analysis
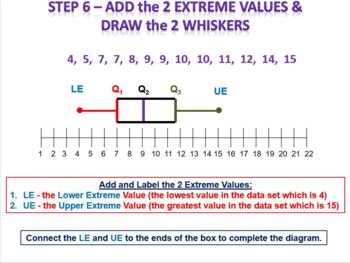
This bundle includes various instructional MS PowerPoint (PPT) slidepacks that I initially use when covering the Math 1/Algebra 1 content area titled: Unit 9 - Statistical Measures and Data Analysis. The following slidepacks are included in this bundle:Box and Whisker Plot Analysis and Construction including Outliers General Statistics - Mean, Median, Mode, Range and Mean Absolute Deviation Mean, Median, Mode, Range and Standard Deviation SummaryScatterplots and Correlation SummaryTwo Way Frequ
Subjects:
Grades:
9th - 12th
Mean, Median, Mode, Range and Standard Deviation Summary
I use this MS PowerPoint presentation file to kickoff our study of Statistics in my 9th grade Math I or Algebra I classes. It reviews the definitions and detailed methods required to calculate the mean, median, mode, range and standard deviation of a data set(s). It is a totally animated ppt file and very easy for students to understand. Any of the ppt animations can be modified as desired by the presenter (teacher). It also includes 2 example problems for the students to complete at the en
Subjects:
Grades:
8th - 9th
CCSS:
Box and Whisker Plot Analysis and Construction including Outliers
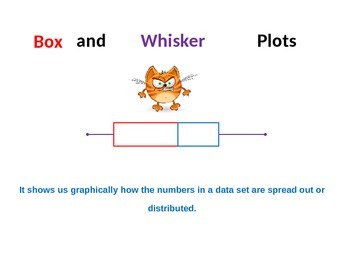
I use this MS PowerPoint presentation file to kickoff our study of Box Plots in my Pre-Algebra and Math I classes. It reviews in detail how to analyze a data set and to construct a Box Plot to accurately depict the distribution of the data (numbers). It is a totally animated ppt file and very easy for students to understand. Any of the ppt animations can be modified as desired by the presenter (teacher). It also includes 2 example problems for the students to complete at the end of the slid
Subjects:
Grades:
7th - 9th
CCSS:
Scatterplots and Correlation Summary
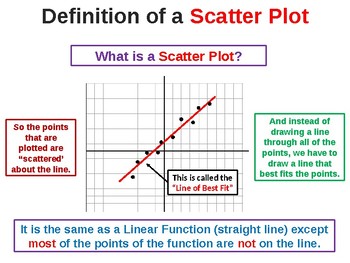
This MS PowerPoint presentation covers the specifics of both Scatterplots and Correlation. It is used to kickoff our study of these topics in my Pre-Algebra and Math I classes. It covers the detailed steps to follow to analyze a data set and construct a Scatterplot and Line of Best Fit as well as determine the Correlation of the data. It covers the steps to use with to determine these measures without a graphing calculator. It is a totally animated ppt file and very easy for students to unde
Subjects:
Grades:
8th - 10th
CCSS:
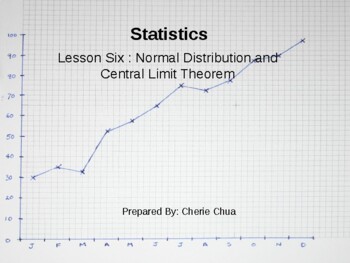
Statistics Topic Six - Normal Distribution and Central Limit Theorem
Here's the Sixth Topic in Statistics Powerpoint LectureStatistics Lecture SixIn this Powerpoint topics are Normal Distribution and Central Limit Theorem. It gives a nourishing lecture about Normal distribution, how to convert values to z-score, how to find area and probability under the normal curve when to use Central Limit theorem and the theorem behind it.Each topic is summarized and easy to understand, rather letting your students read the statistics book. This powerpoint is not wordy it giv
Subjects:
Grades:
8th - 12th, Higher Education, Adult Education
Help with Factorials Combinations and Permutations
In your math (statistics, pre-algebra) class, how many students can really understand the difference between a combination and permutation? My guess is less than half, because that it how it is in my classroom. This lesson, with plenty of practice problems, will definitely help with that understanding rate of less than 50%!!Also included Factorial Worksheets.The format is easy to understand in student-friendly language.Have fun!!
Subjects:
Grades:
8th - 10th
CCSS:
Also included in: Pre-Algebra Curriculum Bundle
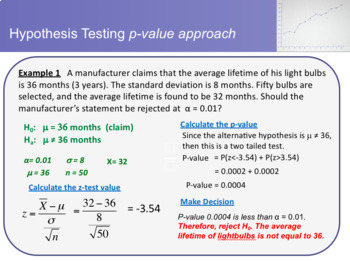
Statistics Topic Nine - Hypothesis Testing with two samples
Here's the Ninth Topic in Statistics Powerpoint LectureIntensive and easy approach in learning hypothesis testing with two samples : 35 slides in all(topics:Large Independent SamplesSmall Independent SamplesDifference between means Dependent SamplesDifference between ProportionsStatistics Lecture NineIn this Powerpoint it discuss how to do Hypothesis Testing with two samples.(2(1) How to decide whether two samples are independent or dependent(2) How to perform a two sample z-test for difference
Subjects:
Grades:
9th - 11th, Higher Education, Adult Education
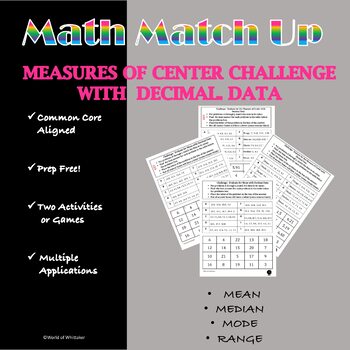
Math Match-Up: Measures of Center with Decimals
This matching activity practices and reinforces the skills of determining Measures of Center utilizing decimal data pieces. This Match-Up contains two separate challenges. The first challenge activity provides a focus on just the Measure of Center Mean. This challenge requires decimal number computation. Challenge activity two requires the knowledge and differentiation between the Measures of Center to evaluate for Mean, Median, Mode and Range. Decimal calculation is required. Math Match-Up Chal
Subjects:
Grades:
4th - 12th
Types:
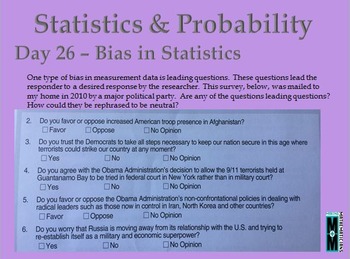
Statistics and Probability Daily Math Slides
These 35 slides focusing on Statistics and Probability are intended to show students the beauty and inter-connectedness of mathematics. These slides can be used as warm-ups or bell ringers or to launch a lesson. Each slide could lead to an extended project or math center. The slides are appropriate for grades 3-12 because they are open-ended or have animation geared to different grade levels. If you purchase all 5 strands of daily math slides you can buy it for a reduced bundled price of $20
Subjects:
Grades:
3rd - 12th

Measures of Central Tendency PowerPoint
Here lies a PowerPoint for a quick review of how to choose the most beneficial measure of central tendency and how to calculate a "wanted" or "missing" piece of data when using mean. This makes a good math center, bellwork, or whole class discussion. Sometimes I use it to pre-test; sometimes for a post-test. ENJOY!
Subjects:
Grades:
7th - 9th

Shannon-Wiener and Simpson Diversity Calculations ppt
Goes over shannon-weiner index and the simpson diversity index- includes, meanings, variable explanations, and interpretation information
Subjects:
Grades:
9th - 12th
Statistics Topic Five - Discrete Probability Distribution
Here's the Fifth Topic in Statistics Powerpoint LectureStatistics Lecture FiveIn this Powerpoint topic is Discrete Probability Distribution. Topics includes in creating a Probability Distribution, when and how to use Binomial Distribution, Geometric Distribution and Poisson Distribution.Each topic is summarized and easy to understand, rather letting your students read the statistics book. This powerpoint is not wordy it gives enough illustration on how to solve each problem cleary and plenty eno
Subjects:
Grades:
8th - 12th, Higher Education, Adult Education
Z Table (Normal Curve) Marker Board Practice (Statistics/AP Stats)
Get ready to supercharge your students' understanding of z scores and z tables with this dynamic activity! With 34 questions and answers conveniently displayed on a PowerPoint presentation, you can easily engage your students in practicing solving z score problems and finding the probability under the z table. Perfect for Statistics and AP Statistics classes, this activity will take your students' skills to the next level and ensure they are fully prepared for any z score challenge that comes th
Subjects:
Grades:
9th - 12th
Types:
CCSS:
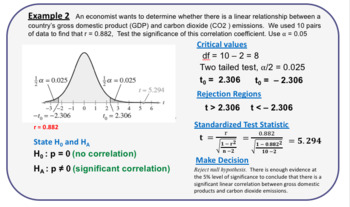
Statistics Topic Ten - Correlation and Regression
Here's the Tenth Topic in Statistics Powerpoint LectureIntensive and easy approach in learning Correlation and Regression : 30 slides in allCorrelation and RegressionCorrelation CoefficientLinear RegressionStandard Error EstimatePrediction IntervalStatistics Lecture TenAll example problems used includes complete and step by step solution!Each topic is easy to understand, rather letting your students read the statistics book. This powerpoint is not wordy it gives enough illustration on how to sol
Subjects:
Grades:
10th - 12th, Higher Education, Adult Education
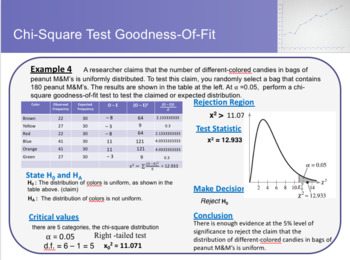
Statistics Topic Eleven - Chi-Square Test
Statistics Topic Eleven - Chi-Square TestHere's the Eleventh Topic in Statistics Powerpoint Lecture Intensive and easy approach in learning Chi-Square Test : 34 slides in allChi-Square TestChi-Square test expected frequencyChi-Square test for Independence Statistics Lecture Eleven All example problems used includes complete and step by step solution! Each topic is easy to understand, rather letting your students read the statistics book. This powerpoint is not wordy it gives enough illustration
Subjects:
Grades:
10th - 12th, Higher Education, Adult Education
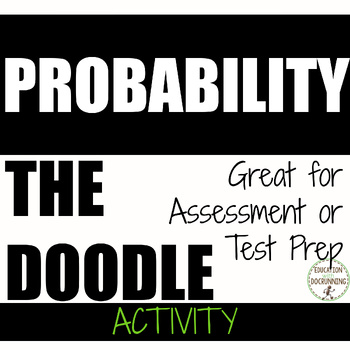
Probability activity Doodle One pager
Students love the doodle activity for Probability is a fun way for Algebra 2 or statistics students to share their knowledge of probability. Students draw, write, and describe different topics related to probability to create their graffiti wall. Great for test prep and assessment.Included in this resource:- 2 probability templates- EDITABLE checklist for one pagerRelated bundles include:★ Algebra 2 Mega Teacher Resource Bundle ★ Probability Unit 10 Curriculum Bundle Algebra 2For more doodle ac
Subjects:
Grades:
9th - 11th
Types:
CCSS:
Also included in: Algebra 2 Curriculum
Statistics Topic Seven - Confidence Interval for Population Proportion and Mean
Here's the Seventh Topic in Statistics Powerpoint LectureStatistics Lecture SevenIn this Powerpoint topics are Confidence Interval for Population Proportion and Confidence Interval for Population Mean. It gives a nourishing lecture and easy to understand about point estimate, margin of error and finally how to construct confidence interval. What is the concept behind it and how to use them.Each topic is summarized and easy to understand, rather letting your students read the statistics book. Th
Subjects:
Grades:
8th - 12th, Higher Education, Adult Education
Statistics Topic three - Measures of Central Tendency, Variation and Location
I'm going to upload the whole Basic Statistics Lecture series from Descriptive Statistics to Inferential Statistics.Here's the Third topic in Statistics Statistics Lecture threeIn this Powerpoint topics covered are: Measures of central tendency, Measures of Variation and Measures of LocationEach topic is summarized and easier to understand rather letting your students read the statistics book. clear examples are given and at the end of each lecture a short exercises is provided for check-up lea
Subjects:
Grades:
7th - 12th, Higher Education, Adult Education
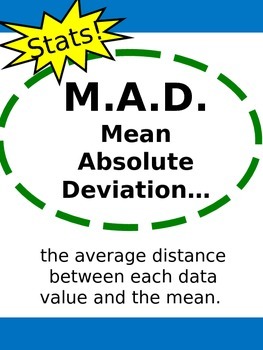
M.A.D. Mean Absolute Deviation
This foldable breaks down the Mean Absolute Deviation process into three easy steps! This resource can be glued into the students' notebooks and can be easily accessed as a reference.
Subjects:
Grades:
5th - 9th
Statistics Topic Four - Probability
Here's the Fourth Topic in Statistics Powerpoint LectureStatistics Lecture FourIn this Powerpoint topic is Probability. It gives a brief introduction about probability, addition rule, multiplication rule and conditional probability. This is a great lecture introduction on connecting descriptive statistics to probability then later to inferential statistics.Each topic is summarized and easy to understand, rather letting your students read the statistics book. This powerpoint is not wordy it give
Subjects:
Grades:
8th - 12th, Higher Education, Adult Education
Showing 1-24 of 28 results


