26 results
High school statistics printables for Microsoft PowerPoint
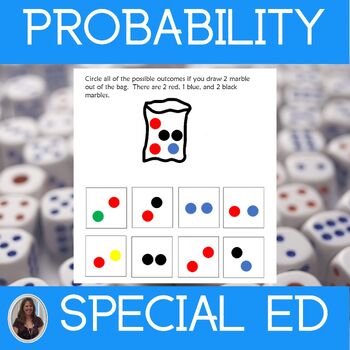
Chance & Probability Math Worksheets Special Education Statistics & Probability
This unit on Chance and Probability contains printable and digital math worksheets for special education. This statistics and probability unit is for students who take alternate assessments.This Chance and Probability unit helps students understand how to determine the probability of an event and all its possible outcomes. The worksheets, which use pictures and color coding, are differentiated. There are many ways for students to practice these skills in this unit that are at different levels.
Subjects:
Grades:
7th - 9th
Statistics Curriculum Statistics and Probability Special Ed Math Curriculum
Save $$$ with this Statistics Curriculum. This special ed math curriculum contains 8 units from my series on statistics including statistics and probability. They were developed for students with autism and special learning needs in middle and high school. Each unit is structured in the same way with similar content to enable your students to make connections and build on what they learn in each unit. This repetition of format helps ease anxiety and free up mental space when learning more di
Subjects:
Grades:
8th - 10th
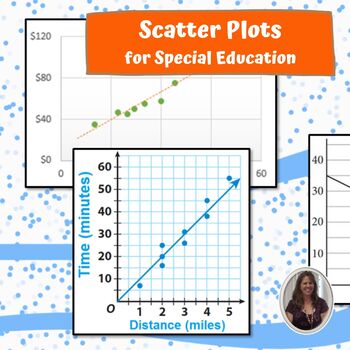
Scatter Plots for Special Education PRINT AND DIGITAL
This unit on Scatter Plots has almost 200 pages and 72 slides of material specifically designed for students with special learning needs, especially autism who are in middle and high school. This unit focuses on helping students interpret and read scatter plots. There are differentiated versions of the worksheets that use pictures and color coding. There are many, many worksheet for students to practice in this unit that are at different levels. There are MANY opportunities for students to e
Subjects:
Grades:
8th - 10th
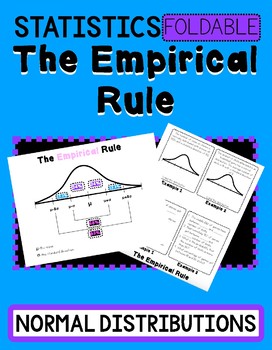
The Empirical Rule- Normal Distribution Foldable & Powerpoint
This resource is for the empirical rule. Students will label normal distributions with 2 real-world scenarios.This resource is accompanied by an animated Powerpoint and or Keynote file to present in the classroom. The presentation includes 8 additional examples. All answer keys are included.Printing:When printing the foldable set the printer to flip on the short side. You will fold the paper “hamburger” style just enough to show the title, The Empirical Rule.Sign up for my email list for freebie
Subjects:
Grades:
8th - 10th
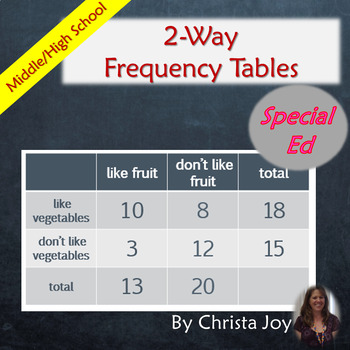
2-Way Frequency Tables for Special Education PRINT AND DIGITAL
This unit on 2-Way Frequency Tables has almost 200 pages and 76 google slides of material specifically designed for students with special learning needs, especially autism who are in middle and high school. This unit focuses on helping students interpret, read, and create 2-Way Frequency Tables as well as Venn Diagrams. There are differentiated versions of the worksheets that use pictures and color-coding. There are many, many worksheet for students to practice in this unit that are at differ
Subjects:
Grades:
8th - 10th
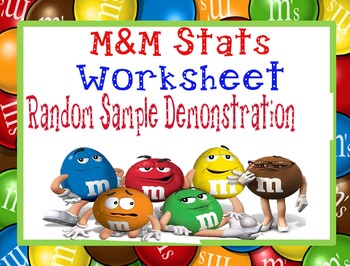
Psychology Random Sample Population Stats M&M Worksheet for Research Methods
Psychology or Statistics Random Sample & Population Statistics M&Ms Worksheet Activity for Research Methods includes a teacher direction sheet with materials that you need and how to complete the activity along with printable handout for students. *Student Favored activity*Please email me with any questions at ReadySetLearnSocialScience@yahoo.comIf you would like to get updates on NEW and CURRENT resources...►FOLLOW Me on Teachers Pay Teachers►FOLLOW Me on Pinterest►FOLLOW Me on Instagr
Subjects:
Grades:
4th - 12th, Adult Education
Types:
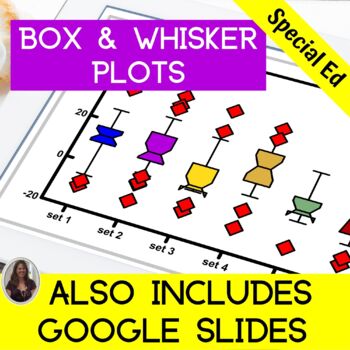
Box and Whisker Plots for Special Education PRINT AND DIGITAL
This unit on Box and Whisker Plots has 100 pages and 30 slides of material specifically designed for students with special learning needs, especially autism who are in middle and high school. This unit focuses on helping students interpret and read box and whisker plots. There are differentiated versions of the worksheets that use pictures and color-coding. There are many opportunities for students to engage in repeated information on learning about what you can learn from box and whisker plo
Subjects:
Grades:
9th - 11th
Surveys Creating and Conducting for Special Education PRINT AND DIGITAL
This unit on Surveys has almost 200 pages and 56 googles slides of material specifically designed for students with special learning needs, especially autism who are in middle and high school. This unit focuses on helping students understand what makes a good survey, how to give one, and how to understand and present the results. There are differentiated versions of the worksheets that use pictures and color-coding. There are lots of ways for students to practice these skills in this unit tha
Subjects:
Grades:
9th - 11th
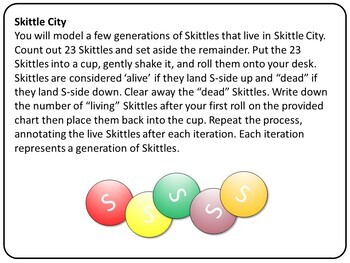
Skittle City: A Fun Mathematical Modeling game for recursion and probability
This exercise is incredibly fun! It is designed to challenge students to explore data analysis and discover about the math concepts of recursion and probability. Students break up in groups and work on modeling a notional Skittle City population. I firmly believe that experience should come before learning formal math formulas and definitions. This is a great way to get the students engaged and have them learn these concepts without even realizing it!Full instructor guide and Answer Key included
Subjects:
Grades:
3rd - 12th
Types:
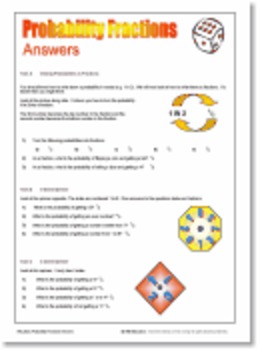
Probability Worksheets, PowerPoints and Interactive Resources
Get to grips with basic probability theory. These activities begin with a range of literacy tasks and posters, then then go on to cover probability words, fractions and sums. Experimental activities are used to test the theory, before moving on to more difficult examples of multiple spinners and dice. A number of Excel tools are included. One, for example, totals and graphs 100 random rolls of a die at the click of a button. Repeated use builds up a picture that time would not otherwise allow. 2
Subjects:
Grades:
6th - 9th, Adult Education

G 11 Maths: Statistics, finance growth and decay in animated PowerPoint.
Simple interest, compound interest, conversion formula, timelines, simple & compound growth, simple depreciation & compound depreciation Histograms, frequency polygons, cumulative frequency graphs, measures of central tendency, measures of dispersion, box-and-whisker plots, distribution curves & scatter plotsExcellent for classroom teaching with a data projector and for use by students at home.
Subjects:
Grades:
11th

La Statistique et la Probabilité
This lesson pack includes a powerpoint introduction to statistics and probability. I have used this lesson with students in grades 7 through 9 (as either an introduction or a review). The powerpoint lesson includes some terms, notes, interactive questions and activities, notes for the teacher where required below slides. Afterwards, there is a printable PDF project that students complete either individually or as partners using Skittles, and paper cups. The project also has students review gra
Subjects:
Grades:
7th - 9th
Math Lab Theoretical and Experimental Probability
Welcome to Kindly Pass the Math! * The following Math Lab is offered as an experimental approach to the relationship between Theoretical and Experimental Probability.A brief explanation defining both Theoretical Probability and Experimental Probability.* Students are introduced to the common terms used in probability calculations: Trial, Outcome, Event.* Students draw chips or marbles from a container and record their results on the Data Recording Sheets provided in the lab. * The lab pro
Subjects:
Grades:
7th - 10th, Adult Education
G 10 Maths Statistics and probability in animated PowerPoint.
Displaying grouped & ungrouped data, central tendency in grouped & ungrouped data, dispersion and 5 number summaryProbability concepts, calculating probabilities, Venn diagrams, union of sets, mutually exclusive events, inclusive events, complimentary events, probability games in lifeExcellent for classroom teaching with a data projector and for use by students at home.
Subjects:
Grades:
10th
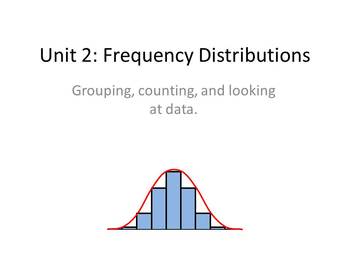
Frequency Distribution Presentation
This is an introduction to frequency distributions, including examples and simple animation. It includes: frequency tables, percentiles, histograms, and stem and leaf diagrams.
Subjects:
Grades:
9th - 12th, Higher Education, Adult Education
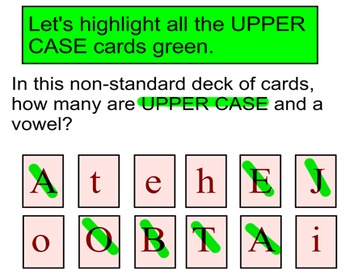
Probability of a Single Event, Independent & Dependent Events for Power Point
Included in this zip folder are 17 Power Point files. 4 files are Introductory lessons, 6 files are assignments and 5 files are references for students. A brief description of each:
Intro #1 is a 36 slide file that introduces the fundamental counting principle. Sample space is defined as the total outcomes found via the counting principle. 12 formative assessment problems are included in the file.
Intro #2 is a 41 slide file that introduces the concept of "and" and "or" as intersection and
Subjects:
Grades:
8th - 11th

G 12 Maths: Statistics, counting and probability in animated PowerPoint.
StatisticsCountingProbabilityExcellent slides for classroom teaching with a data projector and for use by students at home.
Subjects:
Grades:
12th
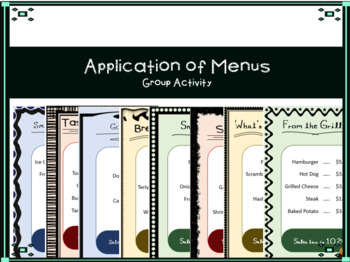
Math Activity with Menus
A set of eight simple restaurant menus students and 16 customer cards per restaurant. These menus can be used toapply calculation of sales taxesconstruct frequency distribution tablescalculate and compare mean of data verses weighted mean
Subjects:
Grades:
9th - 12th, Higher Education
Types:
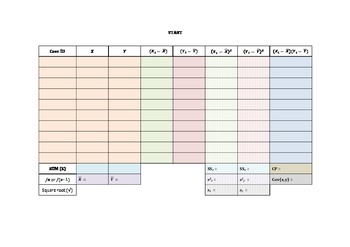
Hand Calculating Pearson's Correlation (and in SPSS too!)
This set of slides provides an easy and colorful way to teach the hand calculation for Pearson's correlation. As a bonus, it also shows output for Pearson's correlation in SPSS, including testing assumptions and result interpretation. Even the most math afraid students will be able to follow this process!
Subjects:
Grades:
11th - 12th, Higher Education, Adult Education

Grade 9 Maths Data handling in animated PowerPoint.
Collecting, organizing and summarizing dataRepresenting, interpreting analyzing and reporting dataExcellent slides for classroom teaching with a data projector and for use by students at home.
Subjects:
Grades:
9th
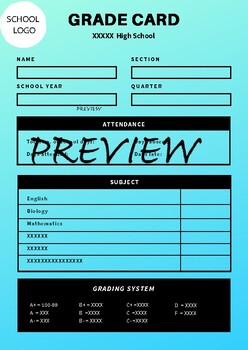
EDITABLE GRADE CARD TEMPLATE
3 editable grade card for high school, easy to use you can add school name and logo, also adding to 6 subjects with gradation system.3 pages format PDF and PPT to make it very easy to update and modify.SIZE:20.9 X 29.7 CMPAGES: 3 TEMPLATES PAGESCOLORS:BLUEBLACKFORMAT:PPTXPDFFOLLOW ME FOR MORE WORKS.
Subjects:
Grades:
8th - 12th, Higher Education
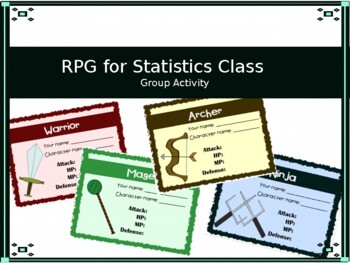
Elementary Statistics - RPG cards
A role-playing game where students choose a character card, form a group of four members, and fight monsters. Students must know how to take the sum and mean of a set of data.
Subjects:
Grades:
9th - 12th, Higher Education
Types:
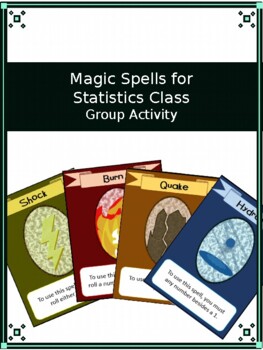
Elementary Statistics - Magic Spell Cards
A game where students use a dice roll to simulate whether or not they can cast the magic spell on the cards. This activity is useful for teaching the differences between empirical and theoretical probability.
Subjects:
Grades:
9th - 12th, Higher Education
Types:
Averages and Range Activity: Build an Army
“Build an Army” is a series of strategy games which can help make a wide range of topics in mathematics more engaging and challenging for all ages and ability levels
As well as helping to develop key skills, students are also encouraged to develop problem solving strategies, which will be useful in all areas of their mathematics.
The activities can be edited and adapted to suit the needs of your students
Each document contains a Build an Army activity, full instructions how to run it in the c
Subjects:
Grades:
4th - 9th
Types:
Showing 1-24 of 26 results


