223 results
High school statistics activities for Microsoft PowerPoint
Statistics Project - Statistics Olympics
Engage your students in their study of statistics as they compete in self-created Olympic style events. This project will engage students and help them discover meaning and apply concepts including measures of central tendency, quartiles, outliers, variance, standard deviation, z-scores, box plots, histograms, normal and skewed distributions. This project can be completed in approximately 6-8 days (50-min class periods) ** March 2023 Update **Visual updates to all slides and documentsRubric ali
Subjects:
Grades:
6th - 12th
CCSS:
Chi Squared
Chi SquaredTeaching Chi Squared to a Stats class or AP Bio and not sure where to start?! Well, you found it. I created this product for my husband, who teaching AP Biology. This pack includes a PPT introduction, complete with student fill-in-the-blank notes, that walk students through the steps of Chi Squared and gives them a general overview of how and why we use this test. Degrees of Freedom are explained, as well as p-value. Notes provide an additional practice problem to do as a class. This
Subjects:
Grades:
9th - 12th
Probability - Tree Diagrams for independent and dependent events
To save you some time when you are preparing your lessons on dependent and independent events, I have collected a bunch of problems that can be solve by drawing tree diagrams and made a slide show of the questions and there answers. The tree diagrams are animated to enable you to explain as you go on. They can also be adjusted very easily and quickly to fit any other problems that you want you learners to solve.There are 6 examples of dependent events and 9 of independent events. I have also inc
Subjects:
Grades:
7th - 12th
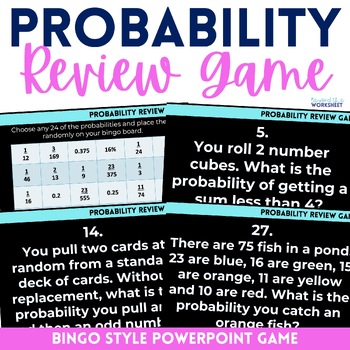
Probability PowerPoint Review Math Game
⭐️ This probability game is a fun way for students to practice or review probability skills. Included are basic and compound probability questions. ⭐️ Students must choose 24 of 30 probabilities to include on their Bingo card. The PowerPoint includes 30 questions for them to solve in order to play Bingo. ⭐️ Included in the file is the PowerPoint, Bingo Card and Answer sheet. Available in the following bundle: 7th Grade Curriculum Resources Mega BundleLicensing Terms:By purchasing this product, y
Subjects:
Grades:
7th - 9th
Also included in: 7th Grade Math Curriculum Supplemental Activities Bundle
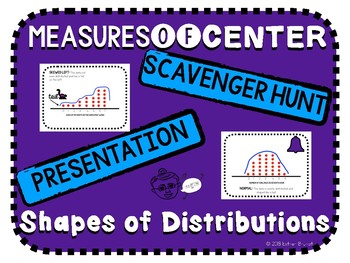
Shapes of Distributions and Measures of Center Scavenger Hunt and Presentation
A note to the teacherThis resource is for teaching shapes of distributions, analyzing the use of the mean versus the median, and deciphering which among the two is higher based on the shape of the distribution.This resource includes:Keynote and Powerpoint Presentation & PDF(Animated)Shapes of DistributionsNormalSkewed LeftSkewed Rigt2 Examples EachWhich Measure of Center is More Appropriate (Mean vs Median)6 Example Knowledge Check Which Measure of Center is Higher (Mean vs Median)?6 Example
Subjects:
Grades:
8th - 12th
Also included in: Math Activity Bundle
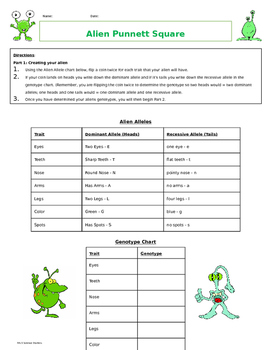
Alien Punnett Square Activity
This is a fun way to teach or reinforce Punnett squares. Students will be creating an alien based on genotypes picked by tossing a coin. Then use those genotypes to draw an alien. Once everyone has their alien, they will then "breed" their aliens to produce offspring. Students can use this activity to learn about...- Punnett squares- Probability- Genetics and HeredityIt is also a great tool for interdisciplinary lessons incorporating math (probability), science (genetics), and art (drawing).As a
Subjects:
Grades:
6th - 9th
Types:
CCSS:
Probability project using Real-World March Madness Tournament
Jump into the March Madness tournament to apply probability concepts to a real-world application. Great for your sports-loving students. Students explore probability first by determining the probability that a team will win. Students, further, weight teams based on historical data and/or team statistics. This mini-project allows for creative problem-solving and has some open-ended answers.Included in this resource:★ Student pages for 3 March Madness related activities★ Detailed guidelines fo
Subjects:
Grades:
7th - 10th
Types:
Also included in: 7th Grade Math Resource Bundle
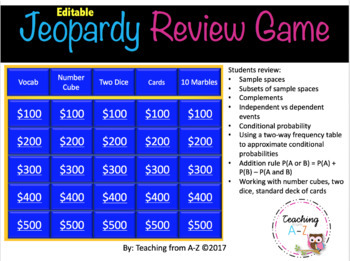
Probability Review Game
Use this Jeopardy-like review game to improve your students' understanding of key concepts in probability. This is a fun way to have students review:*Sample spaces*Subsets of sample spaces*Complements*Independent vs dependent events*Conditional probability*Using a two-way frequency table to approximate conditional probabilities*Addition rule P(A or B) = P(A) + P(B) – P(A and B)*Working with number cubes, two dice, standard deck of cardsThis is a PowerPoint Presentation. You can EDIT the problems
Subjects:
Grades:
9th - 12th
Also included in: Algebra Review Game Growing Bundle
Basic Statistics Year Long Lesson Plan Bundle
Prepare to embark on an exhilarating journey through the realm of statistics with our meticulously crafted nine-lesson plan designed to engage and captivate your students' minds. Each session is a vibrant exploration of statistical concepts, infused with excitement, interactivity, and depth. From introducing the basics of data analysis to delving into advanced techniques, our lessons are brimming with hands-on activities, animated discussions, and real-world applications that will ignite a passi
Subjects:
Grades:
11th - 12th, Staff
Introduction to Factorials and Permutations Presentation, Notes & Practice
Focus of Lesson: Calculate factorials and use the permutation formula.
Lesson: Use the PowerPoint presentation with layered animation accompanied by a whole class discussion.
Alternate Lesson: Does your school have one-to-one computing? Have students view the presentation on their own device. This option allows students to proceed at their own pace and ask the teacher for clarification as needed.
Presentation: Slides 1-3
Student Note-taking Outline: Slides 4-5
20 Practice Problems: Slides
Subjects:
Grades:
8th - 12th, Higher Education
Data Project Misleading Data Analysis Statistics
Statistics can be used to share information. Sometimes the data is misleading. In this AP Statistics mini project students examine how data can be used to tell a story AND how that story can be incomplete. This is part of the AP Statistics curriculum.Included in this resource:Warm-up activity for misleading dataMisleading data project guidelinesEditable RubricAnswer key for activityThis resource can be found in the following bundles:AP Statistics CurriculumAP Statistics Unit 1Get students r
Subjects:
Grades:
9th - 12th
Types:
CCSS:
Also included in: Descriptive Statistics AP Statistics
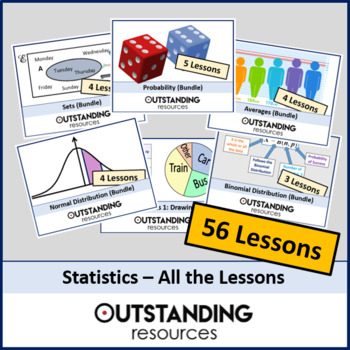
Statistics ALL LESSONS
This is 56 whole lessons with ALL additional resources included! Below is a list (alphabetical) of precisely what lessons are included. If you want more information then all individual lessons are available in my shop and maybe it might be worth buying one or two before purchasing this fantastic bundle. 1. Averages 1 - Mode, Median and Mean2. Averages 2 - comparing the different averages3. Averages 3 - Grouped Data (Estimated Mean) 4. Averages 4 - Mean vs Estimated Mean5. Bar Charts and Compara
Subjects:
Grades:
6th - 12th, Higher Education
Psychology Random Sample Population Stats M&M Worksheet for Research Methods
Psychology or Statistics Random Sample & Population Statistics M&Ms Worksheet Activity for Research Methods includes a teacher direction sheet with materials that you need and how to complete the activity along with printable handout for students. *Student Favored activity*Please email me with any questions at ReadySetLearnSocialScience@yahoo.comIf you would like to get updates on NEW and CURRENT resources...►FOLLOW Me on Teachers Pay Teachers►FOLLOW Me on Pinterest►FOLLOW Me on Instagr
Subjects:
Grades:
4th - 12th, Adult Education
Types:
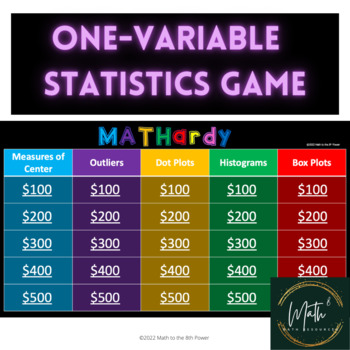
Single Variable Statistics Review Game | One-Variable Stats Game
This "Jeopardy-style" game includes the following categories:Measures of CenterOutliersDot PlotsHistogramsBox PlotsThis activity is a great way to engage students in a review of Single Variable Statistics before an assessment or as a review, and can be used in the classroom or virtually! GREAT FOR AN ENGAGING TEST PREP!You can edit/modify any questions or categories for your own classroom use, but not for commercial use. This .ppt file is fully linked so that the home screen takes you to the q
Subjects:
Grades:
6th - 9th
Types:
CCSS:
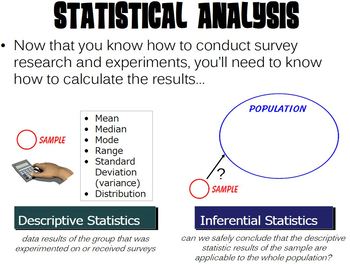
Statistical Analysis PowerPoint
Contains a PowerPoint presentation covering statistical analysis. This PP was designed to be used with a Psychology or AP Psychology course as part of a Research Methods unit, but it could also be used in a variety of math and/or statistic classes.The PowerPoint is HIGHLY animated and is designed to capture student attention. Each slide has transitions along with rich, moving media. Additionally, a guided note sheet (both an editable Microsoft Word version and a PDF version) is included in the z
Subjects:
Grades:
7th - 12th, Higher Education, Adult Education, Staff
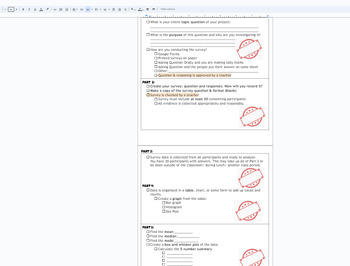
Statistics Survey project Discovery (broken down into sections) with Rubric
This is a broken down (scaffolded) packet of instructions/ guide for a Stats Project for Math 1 HS or 8th grade students. The goal of the project is for students to take a statistical survey on quantitative data (numbers) of their choice. Using this data from the survey, the following will be included in the project:Survey- the question being askedSurvey responses (requirement of 30)Data organization: Bar chart, Histogram, Dot PlotMeanMedianModeBox and Whisket Plot5 number summary (Q1,Q2,Q3, min
Subjects:
Grades:
7th - 12th, Higher Education, Adult Education
CCSS:

Celebrity Birthday Fun Probability Activity for Pre-Algebra and Algebra classes
This 12 minute narrated, animated PowerPoint presentation makes learning the difference between theoretical probability and experimental or empirical probability fun for students. It is intended for 7th, 8th, or 9th grade Algebra classes. It reviews a few Key terms such as probability, event, sample space, etc. and then concentrates on the famous probability birthday problem or paradox in which given a group of 50 people, 97% will share the same birthday.
Three student handouts are included
Subjects:
Grades:
7th - 10th
Statistics, Topic 6: The Binomial Probability Distribution Lesson Plan
Welcome to a statistical journey like no other! Prepare to be captivated as we dive into the fascinating world of numbers, patterns, and probabilities in Topic 6: The Binomial Probability Distribution and Related Topics Lesson Plan. In this immersive lesson plan, spanning an exhilarating 116 slides, you'll embark on a thrilling adventure through animated visuals and thought-provoking problems. Get ready to unlock the secrets of data analysis, explore the depths of probability theory, and unravel
Subjects:
Grades:
11th - 12th
Also included in: Basic Statistics Year Long Lesson Plan Bundle
Statistics, Topic 9: Hypothesis Testing Lesson Plan
Welcome to a statistical journey like no other! Prepare to be captivated as we dive into the fascinating world of numbers, patterns, and probabilities in Topic 9: Hypothesis Testing Lesson Plan. In this immersive lesson plan, spanning an exhilarating 86 slides, you'll embark on a thrilling adventure through animated visuals and thought-provoking problems. Get ready to unlock the secrets of data analysis, explore the depths of probability theory, and unravel the mysteries of statistical inference
Subjects:
Grades:
11th - 12th
Also included in: Basic Statistics Year Long Lesson Plan Bundle

Statistics, Topic 8: Estimation Lesson Plan
Welcome to a statistical journey like no other! Prepare to be captivated as we dive into the fascinating world of numbers, patterns, and probabilities in Topic 8: Estimation Lesson Plan. In this immersive lesson plan, spanning an exhilarating 93 slides, you'll embark on a thrilling adventure through animated visuals and thought-provoking problems. Get ready to unlock the secrets of data analysis, explore the depths of probability theory, and unravel the mysteries of statistical inference. From b
Subjects:
Grades:
11th - 12th
Also included in: Basic Statistics Year Long Lesson Plan Bundle
Statistics, Topic 4: Correlation and Regression Lesson Plan
Welcome to a statistical journey like no other! Prepare to be captivated as we dive into the fascinating world of numbers, patterns, and probabilities in Topic 4: Correlation and Regression. In this immersive lesson plan, spanning an exhilarating 99 slides, you'll embark on a thrilling adventure through animated visuals and thought-provoking problems. Get ready to unlock the secrets of data analysis, explore the depths of probability theory, and unravel the mysteries of statistical inference.
Subjects:
Grades:
11th - 12th
Also included in: Basic Statistics Year Long Lesson Plan Bundle
Statistics, Topic 7: Normal Curves and Sampling Distributions Lesson Plan
Welcome to a statistical journey like no other! Prepare to be captivated as we dive into the fascinating world of numbers, patterns, and probabilities in Topic 7: Normal Curves and Sampling Distributions Lesson Plan. In this immersive lesson plan, spanning an exhilarating 315 slides, you'll embark on a thrilling adventure through animated visuals and thought-provoking problems. Get ready to unlock the secrets of data analysis, explore the depths of probability theory, and unravel the mysterie
Subjects:
Grades:
11th - 12th
Also included in: Basic Statistics Year Long Lesson Plan Bundle
Statistics, Topic 3: Averages and Variations Lesson Plan
Welcome to a statistical journey like no other! Prepare to be captivated as we dive into the fascinating world of numbers, patterns, and probabilities in Topic 3: Averages and Variations. In this immersive lesson plan, spanning an exhilarating 165 slides, you'll embark on a thrilling adventure through animated visuals and thought-provoking problems. Get ready to unlock the secrets of data analysis, explore the depths of probability theory, and unravel the mysteries of statistical inference. F
Subjects:
Grades:
11th - 12th
Also included in: Basic Statistics Year Long Lesson Plan Bundle
Statistics, Topic 2: Organizing Data Complete Lesson Plan
Welcome to a statistical journey like no other! Prepare to be captivated as we dive into the fascinating world of numbers, patterns, and probabilities in Topic 2: Organizing Data. In this immersive lesson plan, spanning an exhilarating 108 slides, you'll embark on a thrilling adventure through animated visuals and thought-provoking problems. Get ready to unlock the secrets of data analysis, explore the depths of probability theory, and unravel the mysteries of statistical inference. From basic c
Subjects:
Grades:
11th - 12th
Also included in: Basic Statistics Year Long Lesson Plan Bundle
Showing 1-24 of 223 results


