Normal Distribution Z-Scores Digital plus Print
- PDF
- Google Apps™
- Internet Activities

Also included in
- This Probability and Statistics Algebra 2 Unit 11 Activities Bundle includes a large variety of engaging quality activities designed to reinforce your students' skills and also help you to easily differentiate your curriculum to meet the needs of all your students. Included are scores of pages of FPrice $36.50Original Price $57.50Save $21.00
- This Algebra 2 Mega Bundle of Activities for Second semester, Units 7 - 12 will keep your students engaged and learning, no matter which Algebra 2 curriculum, text, or notes package you use The large variety of quality activities are designed to reinforce your students' skills and also help you toPrice $175.00Original Price $325.65Save $150.65
- This Algebra 2 Second Semester Bundle of 40 Interactive Digital Activities will engage your students, keeping them on track to success. Topics in the resources are from these Units:Unit 7 – Exponential and Logarithmic FunctionsUnit 8 – Rational and Inverse FunctionsUnit 9 – Conic SectionsUnit 10 –Price $94.50Original Price $147.00Save $52.50
- This Algebra 2 Mega Bundle of Activities for Second Semester, Units 1 - 12, will keep your students engaged and learning, no matter which curriculum, text, or notes package you use. The large variety of quality activities are designed to reinforce your students' skills and also help you to easily dPrice $299.00Original Price $594.49Save $295.49
Description
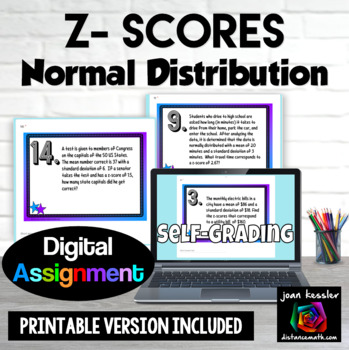
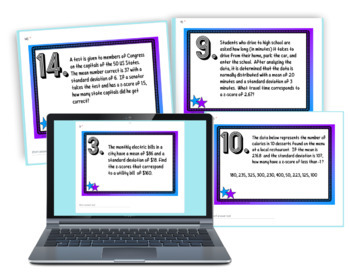
Your students will get extra practice and gain fluency learning about z-scores and the Normal Distribution with both a self-grading digital resource and a PDF printable version.
There are 16 applications to solve with a mix of multiple choice and free response including:
- finding the z-score
- finding the standard deviation knowing the z-score, mean, and data point
- finding the mean knowing the z-score, data point, and standard deviation
- interpreting the z-score.
Your download includes:
- PDF with links to the product.
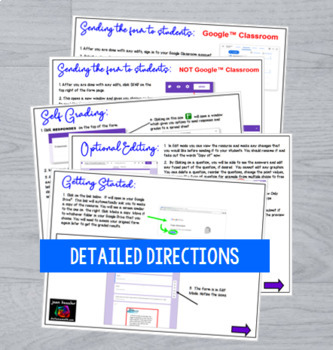
- Detailed illustrated instructions on accessing and sharing this resource with your students for classes with and without Google™ Classroom
- Detailed illustrated instructions on editing this resource
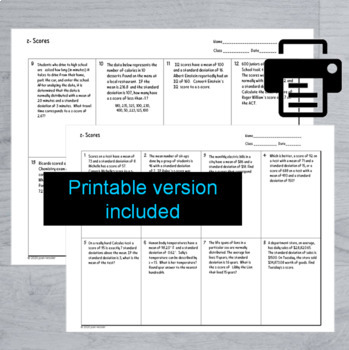
- Printable version of the assignment (free response) in the PDF
- An optional printable response sheet with room to show work to ensure students do the work
- Answer key
- A optional formula graphic is included on the digital version
_________________________________________________________________
Note: You and your students must have a free Google account in order to access the activity but do not need to use Google Classroom to use this resource.
You may also like:
★ Normal Distribution Applications Digital version
★ The Normal Distribution Flip Book Foldable
★ Interactive Normal Distribution App with free software
★ The Normal Distribution on the TI 83 - 84 Plus Applications
★ Interactive Normal Distribution Computer Demo App with free software
★ The Normal Distribution on the TI 83 - 84 Plus Applications
★ Statistics Confidence Intervals for a Proportion Applications
★ Statistics Confidence Intervals for the Mean plus notes
★ Measures of Central Tendency, Mean, Median, Mode Digital Activity
__________________________________________________________________
Connect with me:
✓ Sign up at Joan's World of Math to access my exclusive Free Resource Library
✓ Visit my Facebook Page
✓ Follow me on Instagram
✓ Email me at: joan@joansworldofmath.com with any questions
LICENSING TERMS: The purchase of a license for this resource is for use by one teacher only for his or her students only. No part of this resource is to be shared with colleagues or used by an entire department, school, or district without purchasing the proper number of licenses.
COPYRIGHT TERMS: ©2021 Joan Kessler (joansworldofmath™). This resource may not be uploaded to the internet in any form, including classroom/personal websites or network drives, unless the site is password protected and can only be accessed by students.

