8th Grade Math Scatter Plot: Guided Interactive Lesson
- Google Drive™ folder
- Internet Activities

Also included in
- 8th Grade Common Core Resources:Resources using Google Apps:Number System♦ Rational & Irrational Numbers: Interactive Slides, Digital Assessment♦ Understanding Pi Digital Breakout♦ Self Checking ActivitiesExpressions & Equations♦ Exponents Rules: Interactive Slides, Quiz♦ Square Roots &Price $220.00Original Price $251.75Save $31.75
- Extensive ALL digital guided lessons for 8th Grade Math Common Core Standards.The digital resources include Guided Interactive Lessons using Google Slides, Self Grading Google Forms, Google Drawing Sorts, Self Checking Mystery Pictures using Google Sheets, and Google Site Breakouts. Google slides aPrice $165.00Original Price $185.00Save $20.00
Description
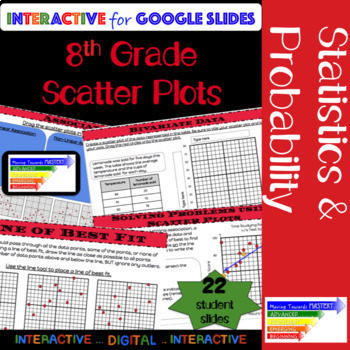
Extensive ALL digital guided lesson for constructing and interpreting scatter plots.
The slides are scaffolded to build understanding. Students will progress from identification of terms to making predictions involving bivariate data. The guided slides will begin with identification, move towards assisted analysis, and conclude with independent practice.
Slides include...
♦ Definitions and Visual Representations
♦ Identification and Use of Terms
→ Bivariate Data
→ Scatter Plot
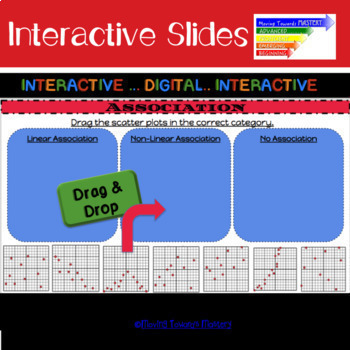
→ Linear, Nonlinear, & No Association
→ Positive & Negative Association
→ Outliers
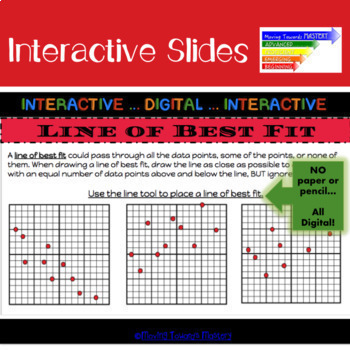
→ Line of Best Fit
→ Interpolate & Extrapolate
♦ Guided steps for...
→ How to Describe the Relationship for Bivariate Data
→ Drawing a Line of Best Fit
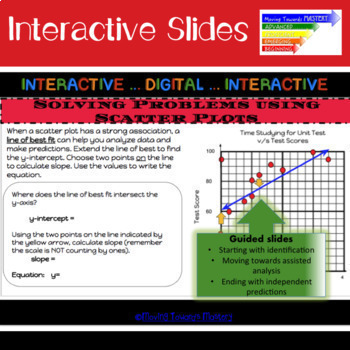
→ Creating an Equation to Represent the Line of Best Fit
→ How to use the Line of Best Fit and Equation to Make Predictions
22 interactive student slides involving basic scatter plots and seven real world data sets are included along with a teacher's guide and answer key.
The Scatter Plots Interactive can be used as an introductory lesson, guided practice, or culminating task. Students will progress from identification of terms to making predictions involving bivariate data.
♥ Love the lesson, but want a NO PREP Printable instead? Check out the Printable version:
8th Grade Math Scatter Plots Printable
♥ Looking for a project based Scatter Plot lesson? Check out the link below:
♥ Love the lesson? Want more 8th Grade Google Interactives? Click below:
Mystery Picture for Scatter Plots
Scientific Notation Interactive
Rational & Irrational Numbers Interactive
Transformation Vocabulary Interactive
Check out other Google Activities:
Exploring Rotations Partner Challenge Google Slides
Transformation Rules Quiz Google Forms
Tis the Season Transformation Project INTERACTIVE Google Slides
Systems of Equations GRAPHING Interactive Google Drawing Sort
★ Follow Me to be notified of NEWLY released Google Interactives.
--------------------------------------------------------------------------------------------------------------------------------------------------------------
Licensing Terms :
By purchasing this product, you own a license for one teacher only for personal use in their own classroom. Licenses are non-transferable, unless you have purchased a transferable license, and therefore can not be passed from one teacher to another. If the teacher who purchased this license leaves the classroom or changes schools, the license and materials leave with that teacher. No part of this resource is to be shared with colleagues or used by an entire team, grade level, school or district without purchasing the correct number of licenses.
Copyright Information :
© Moving Towards Mastery
Please note - all material included in this resource belongs to Moving Towards Mastery. By purchasing, you have a license to use the material but you do not own the material. You may not upload any portion of this resource to the internet in any format, including school/personal websites or network drives unless the site is password protected and can only be accessed by students, not other teachers or anyone else on the internet.


