183 results
High school statistics lectures for Microsoft PowerPoint
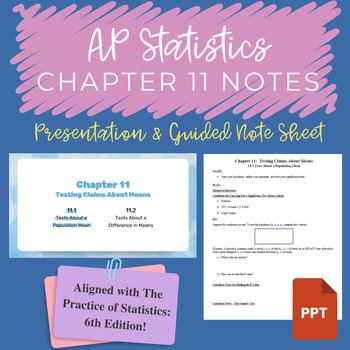
AP Statistics Chapter 11 Notes PowerPoint and Guided Notes
Aligned with The Practice of Statistics (Sixth Edition); a presentation for the eleventh full chapter of AP Statistics (11.1 and 11.2 ), Testing Claims About Means. Includes: Tests About a Population Mean; and Tests About a Difference in Means. This file includes PowerPoint presentations for 11.1 and 11.2, along with their associated guided notes.This file is in PowerPoint format for the presentation and a PDF of the notes. If you prefer Google Drive, I have another file in my store that would b
Subjects:
Grades:
10th - 12th
CCSS:
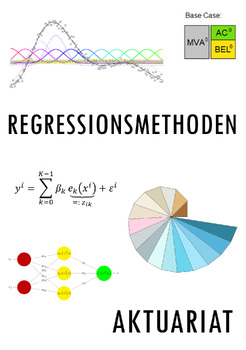
Regressionsmethoden im Aktuariat (Präsentationsfolien)
Lernziel: Überblick über verschiedene Regressionsmethoden, Machine Learning Ansätze und künstliche neuronale Netze sowie Transfer der Theorie auf eine praktische Anwendung im Risikomanagement von VersicherungsunternehmenIn diesen Präsentationsfolien werden diverse adaptive Machine Learning Ansätze ausgehend von der Methode der kleinsten Quadrate und Modellwahlkriterien zur Herleitung der Verlustfunktion (sog. "Proxyfunktion") eines Lebensversicherers in Abhängigkeit seiner Risikofaktoren (z.B.
Subjects:
Grades:
11th - 12th, Higher Education, Adult Education
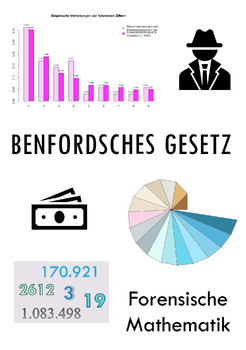
Benfordsches Gesetz (Präsentationsfolien + R Code)
Lernziel: Umgang mit dem Benfordschen Gesetz und Einblick in die "Forensische Mathematik", Transfer der Theorie auf praktische Anwendungen in der Wirtschaftskriminalität, Programmierung in statistischer Software RDas Benfordsche Gesetz zeigt, wie Forensische Mathematik dazu beitragen kann, Betrug aufzudecken. Es ist ein wichtiges Instrument, um z.B. Wirtschaftskriminalität oder auch andere Fälle von Datenfälschungen aufzuspüren. Das Benfordsche Gesetz verblüfft, ist anwendungsbezogen und eignet
Subjects:
Grades:
11th - 12th, Higher Education

Statistics Module Bundle
Dear Customers!This Statistics Module Bundle file contains 18 lectures which are covered during Statistics Module.Each lecture containing:- Lecture PPT- Test Bank with answers for each lecture - Exercises for seminars/lectures with answers
Subjects:
Grades:
6th - 12th, Higher Education, Adult Education, Staff
AP Statistics Bundle: Lecture/Worksheets - Hypothesis Testing, Confidence & More
This bundle includes the following presentation/lectures:- 22-slide presentation on Independence and Conditional Probability- 41-slide presentation on the Normal Distribution & Z-Scores- 55-slide presentation on the Student's T-Distribution- 96-slide presentation on Confidence Intervals & Hypothesis Testing- 49-slide presentation on Chi-Square Goodness of Fit TestingA Cumulative Final Exam with 36 questionsWorksheets on probability, sampling and box & whisker charts, measures of cent
Subjects:
Grades:
10th - 12th, Higher Education, Adult Education
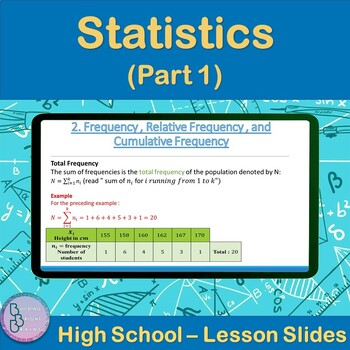
Statistics Part 1 | High School Math PowerPoint Lesson Slides
Are you teaching your High School students about Statistics? Plenty of examples and application exercises are included. You can also easily convert this to a Google Slides lesson by dragging it into your Google Drive.What is included?✦ 30 total slides for notes, examples and applications.✦ All steps are animated to allow the teacher to explain them gradually. Throughout the Lesson, students will be introduced to the following:✦ Statistics Vocabulary✦ Frequency , Relative Frequency , and Cumulati
Subjects:
Grades:
10th - 12th, Higher Education
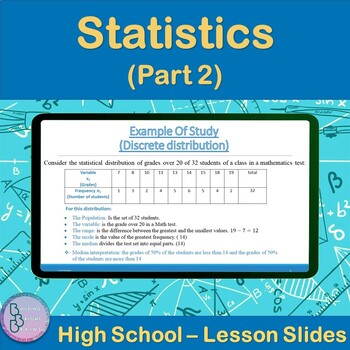
Statistics Part 2 | High School Math PowerPoint Lesson Slides
Are you teaching your High School students about Statistics (Part 2)? Plenty of examples and application exercises are included. You can also easily convert this to a Google Slides lesson by dragging it into your Google Drive.What is included?✦ 18 total slides for notes, examples and applications.✦ All steps are animated to allow the teacher to explain them gradually. Throughout the Lesson, students will be introduced to the following:✦ Statistical Vocabulary✦ Discrete distribution✦ Continuous d
Subjects:
Grades:
10th - 12th, Higher Education
Elementary Statistics PowerPoints - Full Course Bundle
Elementary Statistics PowerPoints (Full Course Bundle)This product includes PowerPoints for every lesson in my Elementary Statistics Curriculum. Click "Preview" to see the entire list of PowerPoint lessons included.Related ContentClick here to view more Elementary Statistics Products----Customer Tips----Get credit for future purchases:Please go to your "My Purchases" page (you may need to login). Beside each purchase you'll see a "Provide Feedback" button. Simply click it and you will be taken t
Subjects:
Grades:
10th - 12th, Higher Education
Probability and Statistics Unit C Inference Powerpoint Lecture
Probability and Statistics Unit C Inference Powerpoint Lecture
Subjects:
Grades:
9th - 12th
Types:
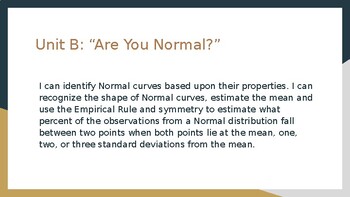
Probability and Statistics Unit B Normal Distribution
Probability and Statistics Unit B Normal Distribution Powerpoint Lecture
Subjects:
Grades:
9th - 12th
Types:
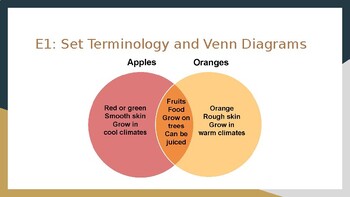
Probability and Statistics Unit E Probability Powerpoint Lecture
Probability and Statistics Unit E Probability Powerpoint Lecture
Subjects:
Grades:
9th - 12th
Types:
Probability and Statistics Unit D Statistical Experimenting Powerpoint Lecture
Probability and Statistics Unit D Statistical Experimenting Powerpoint Lecture
Subjects:
Grades:
9th - 12th
Types:
Conditional Probability
This PowerPoint lesson was created for a Pre-Calculus class to review all the concepts of conditional probablility that were previously learned in Algebra 2. It includes examples and explanations of compound probability (including unions and intersections), independent & dependent events, and mutually exclusive events. It could be used as a review in Algebra 2 once all these concepts have been covered.
NOTE: Math Type 5.0 was used to create this lesson.
Subjects:
Grades:
10th - 12th, Higher Education
Data Representation Powerpoint
The presentation contains: 1) TALLY MARKS Learning Objectives. Definition of a tally mark. Uses of tally mark. How to count a tally mark. Tally Mark Chart. Construction of a tally mark table with an example. Application on real life problems on tally mark. Read and Interpret a tally mark table.The presentation contains: 2) FREQUENCY DISTRIBUTION TABLEDefinition of a Frequency Distribution Table. Types of Frequency Distribution Table: a) Discrete Frequency Distribution Table (Ungrouped).b) C
Subjects:
Grades:
1st - 10th, Higher Education, Staff
A Roadmap for Analyzing Data (Statistics)
A Roadmap for Analyzing Data is a lecture which is covered within the Statistic or Basic Business Statistic module by business and economics students. Choosing appropriate statistical methods for your data is the single most important task you face and is at the heart of “doing statistics.” But this selection process is also the single most difficult thing you do when applying statistics! How, then, can you ensure that you have made an appropriate choice? By asking a series of questions, you can
Subjects:
Grades:
5th - 12th, Higher Education, Adult Education, Staff
Also included in: Statistics Module Bundle
Year 10 Math on Statistics - PowerPoint Slides - Chapter Summary
Enhance your Year 10 Mathematics class with this comprehensive collection of PowerPoint slides summarising the fundamental concepts of Statistics. Designed specifically for teachers and students, this meticulously crafted resource covers a wide range of topics to engage and educate your students.With clear explanations, vibrant visuals, and engaging examples, these PowerPoint slides offer an invaluable resource for educators seeking to deliver dynamic and effective Statistics lessons. Empower yo
Subjects:
Grades:
10th
Mathematical Expectation (Expected Value)
This is a Pre-Calculus lesson on Mathematical Expectation: what to expect as the average outcome if an experiment were to be repeated many times. (also called "Expected Value") It gives an explanation, then gives 7 example problems.
Subjects:
Grades:
10th - 12th, Higher Education
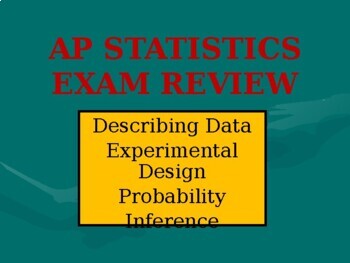
AP Statistics Full Course Review Presentation/Lesson - 110 Slides - 4 classes
Review presentation covering full AP Statistics Course. 110 slides covering approximately 50 problems, with questions, answers, steps, and a few some mini-reviews thrown in. Some questions are conceptual but most involve calculations. Presentation is highly animated with formulas coming in to show steps. Also includes Z-tables and interpretation.Topics:Describing DataExperimental DesignProbabilityInferenceI covered this material over four one-hour classes in my AP Stats class.
Subjects:
Grades:
10th - 12th, Higher Education
CCSS:
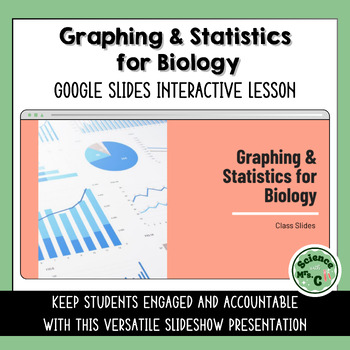
Graphing & Statistics for Biology Google Slides Lesson
Features a Google Slides lesson/presentation that reviews how to make scientific data tables, graph scientific data, and calculate mean, median, mode, and range.The topics covered in this presentation include:Identifying types of DataConstructing Data TablesCalculating Mean, Median, Mode, Range & Standard DeviationPlotting a GraphInterpolation & Extrapolation of DataKeep your students engaged and accountable with this interactive, versatile presentation. Embedded within these 27 colorful
Subjects:
Grades:
6th - 12th
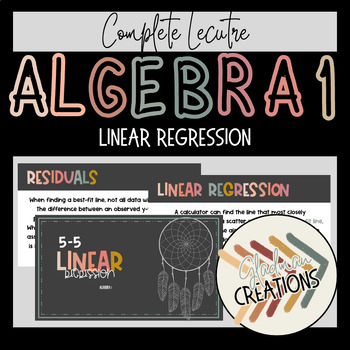
Algebra 1 Lesson - Linear Regression
This complete lesson can be used with any curriculum and each student will be able toWrite equations of best-fit lines using linear regressions.Determine how well functions fit sets of data.This lesson is done with a bohemian style color pallet; all material is editable, if you need to adjust to your teaching style or your classroom curriculum.
Subjects:
Grades:
9th - 12th
CCSS:
Also included in: Algebra 1 Lesson BUNDLE - Creating Linear Equations
Statistics in Research found in Social Science
This google slide presentation teaches the understanding of statistics found in Social Science research. In this 19 slide presentation the following topics are covered…-Qualitative vs Quantitative Research-Mean, Median, Mode, Midrange, and Range-Curves and Distributions-Correlation-Control group, causatition, blind experiment, confederate etc…There are images and a few videos to highlight the talking points found in this presentation.This lesson is intended for Grade 11 and 12 students (cours
Subjects:
Grades:
9th - 12th, Higher Education, Adult Education
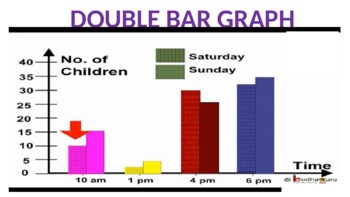
Double Bar Graph Powerpoint
The presentation contains:Learning Objectives.Definition of a double bar graph.Parts of a double bar graph.Difference between bar graph and double bar graph.Tips for construction of double bar graph.Steps to construct double bar graph with an example.To read and interpret the double bar graph.
Subjects:
Grades:
5th - 10th, Staff
Also included in: Data Representation Powerpoint
Intro to Statistics
This presentation covers applications of statistics, measures of central tendency (mean, median mode), quartiles, measures of dispersion (range, standard deviation), outliers, percentiles, intro the to Central Limit Theorem, the normal distribution, (bell-shaped curves), sample vs. population.Slides are animated and will walk through solving problems.Best taught over 2-3 lessons.
Subjects:
Grades:
7th - 12th, Higher Education, Adult Education

Pie Chart Powerpoint
The presentation contains:Learning Objectives.Definition of a Pie Chart.Tips for construction of pie chart.Steps to construct a pie chart with an example.Scaling and drawing a pie chart.Read and Interpret a pie chart.
Subjects:
Grades:
5th - 10th, Staff
Also included in: Data Representation Powerpoint
Showing 1-24 of 183 results


