17 results
Instructional technology centers for Microsoft Excel
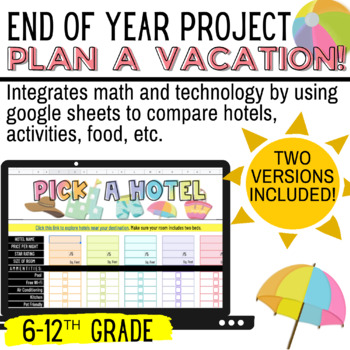
END OF YEAR MATH PBL: Plan A Vacation! | Math + Technology
Running out of ideas during the end of the year? Then this is a MUST HAVE!This is a Google Sheet activity that combines math skills with technology. Students will have fun exploring a vacation destination of their choice and researching hotels, activities, food, and vehicles for their trip. There are two versions included for differentiation:Version OneEasier option for students that want to compare their choices, but aren't ready to use Google Sheet formulas.The formulas are already embedded so
Grades:
6th - 12th
Types:

What Will My Car Cost? - A Project in Microsoft Excel | Distance Learning
The “What Will My Car Cost?” project allows students to build skills in Internet research and critical thinking as they research costs for a car and then compute and compare payment options using Microsoft Excel. First, students research the cost for two car options (one used and one new) and then compare financing and payment options for these using formulas in Microsoft Excel. The step-by-step directions were created for Microsoft Excel 2016, but could easily be used with earlier versions of
Grades:
6th - 9th
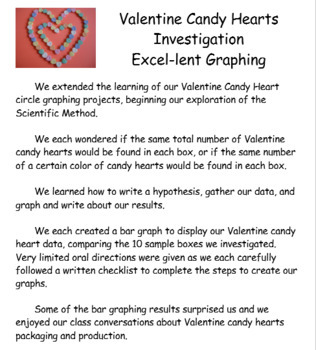
Excel Graphing Valentine Candy Hearts Investigation
#welovecandyheartsThis integrated Math/ Science/ Technology project is a great way to make statistics and probability real, relevant, fun, and delicious!Students will create bar graphs using Excel to display Valentine candy hearts data, as students consider packaging and production of small Valentine candy heart individual boxes. Project file includes sample bulletin board display poster, project directions in individual student checklist form, and rubric to grade the finished graph.Project file
Grades:
5th - 7th
Types:
NGSS:
3-5-ETS1-2
, MS-ETS1-3
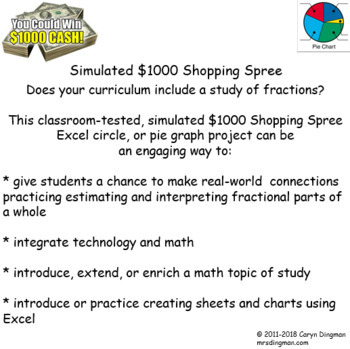
Excel Graphing $1000 Simulated Shopping Spree
Does your curriculum include a study of fractions?This classroom-tested $1000 Simulated Shopping Spree Excel circle, or pie graph project can be an engaging way to:* give students a chance to make real-world connections practicing estimating * interpret fractional parts of a whole in a way that's personal and unique* integrate technology and math* introduce, extend, or enrich a math topic of study* introduce or practice creating sheets and charts using ExcelThis classroom-tested project file in
Subjects:
Grades:
4th - 6th
Types:
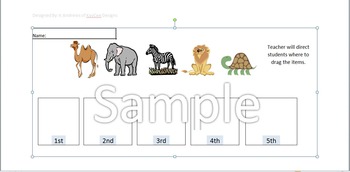
Ordinal Numbers-Computer Activity & Math Center
This is a drag and drop activity created for Kindergarten and First Grade students. Students drag items to boxes labeled with ordinal numbers. The template is easy for students to use. It can be used as a teacher directed activity or as a math center. There are three templates.The templates cover the numbers first, second, third, fourth and fifth. The numbers can be changed upon request. Teacher direction included in the download.
Subjects:
Grades:
PreK - 2nd
Types:
Excel Graphing Easter Fruit Snacks with Digital Student Directions
How About a Little Excel-lent Graphing to Add to Your Digital Learning Resources?Let’s Go Paperless!This digital, paperless Easter Fruit Snacks Data Collection and Excel Graphing Activitycan be an engaging way to:* integrate math, technology, and Next Generation Science and Engineering Practices* extend and enrich a math topic of study* introduce or give students additional practice creating sheets and charts using Excel* give students a real, personal, and unique way to compare data that’s fun
Excel Graphing Planet Weights with Digital Student Directions
Does your curriculum include a study of the solar system and/or forces and motion?Want to give your students a real-world and personal way to practice decimal multiplication?This Planet Weights Excel Project can be an engaging way to:* integrate technology, math, and Next Generation Science and Engineering Practices* introduce, extend, or enrich a math and science topic of study* introduce or practice creating sheets and charts using Excel* give students a chance to make connections across the c
Subjects:
Grades:
3rd - 6th
Types:
NGSS:
5-ESS1-2
, MS-PS2-4
Excel Graphing Temperature Comparison
What's the temperature like in YOUR town? Does your curriculum include a study of weather factors? This Temperature Comparison Excel double-bar graph project can be an engagingway to:* integrate technology, math, science, and geography* introduce, extend, or enrich a math, social studies, or science topic of study* introduce or practice creating sheets and charts using Excel* give students a chance to make connections across the content areasThis classroom-tested project file includes: * student
Grades:
4th - 6th
Types:
NGSS:
5-ESS1-2
, 3-ESS2-1
, 3-ESS2-2
, 5-ESS2-1
, MS-ESS2-6
...
Excel Graphing Lucky Charms Marshmallows
Give your students a real-world chance to compare Lucky Charms cereal marshmallow data in a way that's personal and unique!This Lucky Charms Marshmallows Excel Project can be an engaging way to:* integrate technology* introduce, extend, or enrich a math topic of study* introduce or give students additional practice creating sheets and charts using Excel The classroom-tested product file includes:* student project directions sheet, in checklist form* rubric to score each completed graph* sample b
Grades:
3rd - 6th
Excel Graphing Pulse Rate Comparison
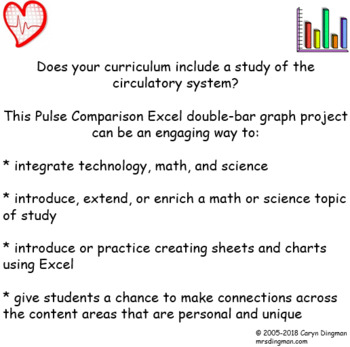
Does your curriculum include a study of the circulatory system? This Pulse Comparison Excel double-bar graph project can be an engaging way to:* integrate technology, math, and science* introduce, extend, or enrich a math or science topic of study* introduce or practice creating sheets and charts using Excel* give students a chance to make connections across the content areasStudents will be encouraged to wonder… Would the time of day and what we were doing affect our pulse rates?Pulses will be

Star Wars Basic Excel Project
This is a simple project that uses an Excel template to help students learn to use basic functions in Excel using the theme of Star Wars.
Students are given a mission that they have been invited to Skywalker Ranch and their friends want them to bring back items from the gift shop.
The additional paper has items for sale that are related to Star Wars the somewhat current prices.
Student then use this sheet to determine how much money they need to be given from each person.
You can make this m
Grades:
5th - 8th
Types:
Excel Graphing Valentine Conversation Hearts
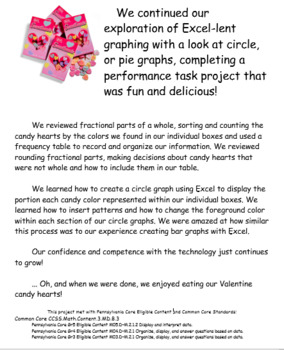
Explore Excel circle graphing with a Valentine's Day project that's fun and delicious!Students will create circle, or pie graphs using Excel to display Valentine candy hearts' data. Fractional parts of a whole will be reviewed and discussed as part of the project. Project file includes sample bulletin board display poster, project directions in individual student checklist form, and rubric to grade the finished graph.Project file student directions have been updated for Excel 2016.This project w
Grades:
3rd - 6th
Guided Math Rotations
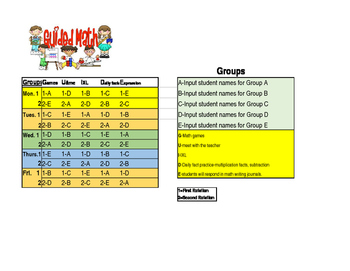
This is an Excel spreadsheet that can be quickly and easily edited for your math center needs. This displays on your Smartboard and will keep your students focused and on task. Your classroom will instantly be transformed and your students will be learning their state objectives while having fun!
Grades:
2nd - 7th
Types:
Multiplication Properties Practice
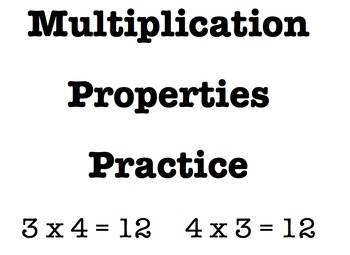
This document can be opened in Apple's Numbers App. It was designed for the iPad, but can be used on a Macbook too. Students will select the multiplication property that matches the provided equation. With the drop-down menu provided, students will be able to choose the correct property without having to spell the property. Properties included are Identity, Zero, Distributive, Commutative, and Associative.
Grades:
3rd - 6th
Types:
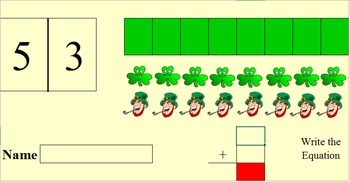
St. Patrick's Day: Deconstructing Numbers
Students drag shamrocks and leprechauns to boxes to illustrate and add numbers. Then, they write the addition equation. The answer box turns green, when correct. There are four activities that add up to eight and four activities that add up to six.
I can revise the sheet for specific numbers or needs. Contact me with your requests.
Grades:
PreK - 2nd
Types:
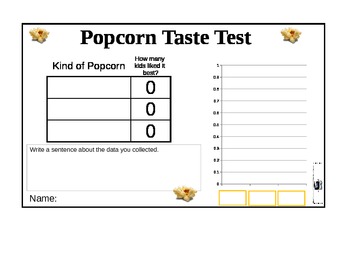
Graphing Flavors of Popcorn
This is an Excel spreadsheet designed for use with first graders. Students sample 3 types of popcorn (butter & salt, chocolate, and candied popcorn), then a class vote is done. Students move the labels onto the data chart and graph. There is space for students to type in the votes and a sentence about their data.
Grades:
K - 1st
Character Traits and Definitions for Excel or Numbers
Students often have a difficult time describing characters. Why not allow students to research different character traits and create a list to refer back to when describing a character. Available for Excel or Numbers, students can use this chart to record and organize their character traits and definitions to easily use in the future.
Grades:
1st - 7th
Types:
Showing 1-17 of 17 results

