6 results
Statistics centers for Microsoft Excel
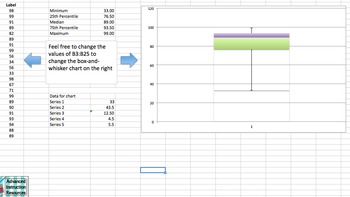
Box and Whisker Plot - Excel Template
This Excel box-and-whisker plot template allows the user to enter data and watch as the maximum, minimum, median, and quartiles change. The changes will also happen to the box-and-whisker plot that has already been created for you. I've used this to show how different values impact the quartiles within a box-and-whisker plot. It's also another way to showcase the formulas in finding central tendency terms. Enjoy!
Subjects:
Grades:
5th - 8th
Types:
CCSS:
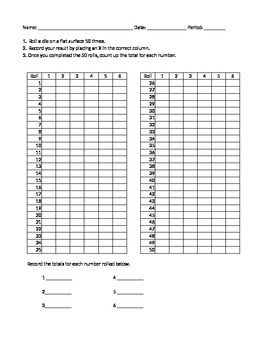
Die Probability Activity
Students roll a die 50 times and record the data on the data sheet.
Total up each column.
Write results as a fraction, decimal, and percent.
Answer questions comparing theoretical and experimental probability.
Need 1 die per student or small group of students.
Subjects:
Grades:
5th - 7th
Types:
CCSS:
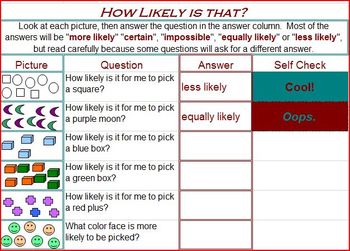
Interactive Game: Probability
GREAT FOR CENTERS! This game is a great quick check of student understanding for basic probility situations. Students type responses and are given immediate feedback. At the end, the worksheet is printable and already scored.
There are two separate games on the same file. The tabs at the bottom of the workbook are labeled.
Subjects:
Grades:
2nd - 5th
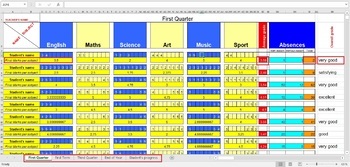
Calculate Student's Final Marks ( Grades ) in excel
If you want to easily calculate student's marks this excel document is great solution. I added all excel's necesarily formulas to make this important task so easier.When you add the marks for every subject, it's final mark will be automatically calculated. At the same time average grade will also be calculated and updated.There is also section for absences (excused and unexcused) which will also be calculated.At the end, if student's Overall grade is equal or above 4.5, it will be automaticaly w
Subjects:
Grades:
PreK - 12th, Higher Education, Adult Education, Staff
Types:
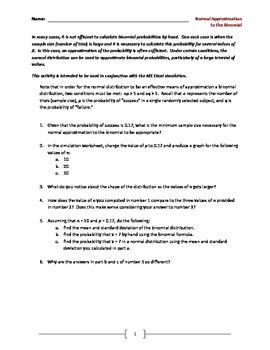
Normal Approximation to the Binomial Worksheet
INTENDED TO BE USED IN CONJUNCTION WITH THE MS EXCEL SIMULATION WORKSHEET ON THE SAME TOPIC.
This activity walks students through the logic behind the comparison between the binomial distribution and the normal distribution. In particular, it is demonstrated that in order for the binomial distribution to have an approximately mounded and symmetric distribution, np and nq must both be greater than 5. The simulation in MS Excel that goes with this exercise can be used to show this easily. Stud
Subjects:
Grades:
11th - 12th, Higher Education
Types:
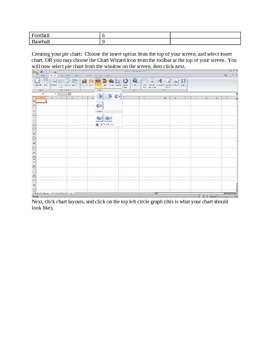
Excel Survey Project
I am Mr. Poole. I do this project with my math class, however, it could easily be adapted to other subjects. This survey project teaches students the basic functions of performing a survey and how to best present the results. Students will do the following: choose a topic to survey, formulate a question that they will ask people, predict what the outcomes may be, keep tally/frequencies of responses, input their data into an excel spreadsheet which will generate a circle/bar graph, design th
Subjects:
Grades:
5th - 8th
Showing 1-6 of 6 results


