19 results
Applied math centers for Microsoft Excel
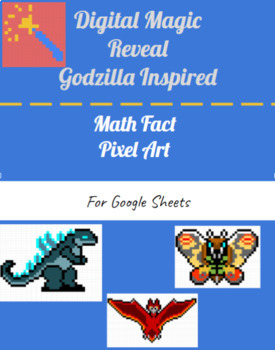
Godzilla Inspired Math Mystery Pixel Art
This product is a wonderful way for students to drive their math facts through a mystery math picture! This product can be edited, using the directions provided, and used to differentiate math facts for a variety of students and grades. This product can be used on Google Classroom, Google Drive, and in Excel.
Subjects:
Grades:
3rd - 5th
Types:
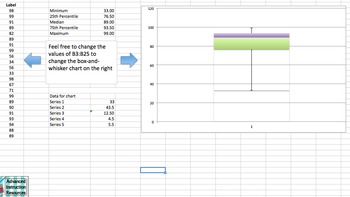
Box and Whisker Plot - Excel Template
This Excel box-and-whisker plot template allows the user to enter data and watch as the maximum, minimum, median, and quartiles change. The changes will also happen to the box-and-whisker plot that has already been created for you. I've used this to show how different values impact the quartiles within a box-and-whisker plot. It's also another way to showcase the formulas in finding central tendency terms. Enjoy!
Subjects:
Grades:
5th - 8th
Types:
CCSS:
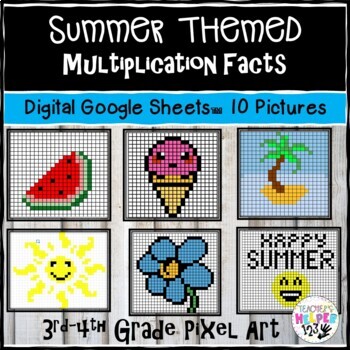
10 Pixel Art | Summer Themed | 3rd-4th Math | Digital Multiplication Facts
This fun and exciting pixel mystery picture activity is perfect for practicing multiplication facts! Included in this resource: -10 pages/ activities with different mystery pictures that are summer themed-Multiplication facts for (3,4,5,6,7,8,9,10,11 and 12) including mix fact pages-Some of the questions require the student to multiply 3 numbers (perfect for a challenge)How It Works-Use the link in the attached PDF to force a copy to each student. You can also assign the activity in Google class
Subjects:
Grades:
3rd - 4th
Types:
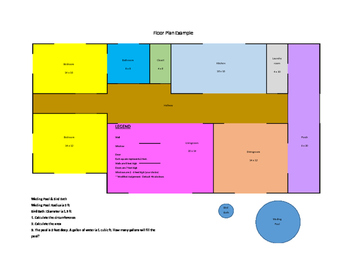
Math House Measurement Project Floor Plan
This is the floor plan for the Math House Measurement Project. Use this as a starting point.
Students can create their own spaces, go outside the provided package and 'shop' online for materials to add to their house/remodel.
*There are some errors in the package. I will revise soon and try to clean it up.
Note: You will have to photocopy a few more of the Room Calculation Sheets, and the Pool and Bird Bath should be squared, not cubed.
Subjects:
Grades:
6th - 8th
Types:

Elementary Economics
Elementary Economics:
Revenue-Cost=Profit
Every little entrepreneur should understand how money makes money and what is involved in selling a product to make a profit!
This download has three worksheet pages:
1. Cost
2. Revenue
3. Profit
Some vocabulary with very simplified definitions. Totally editable.
Students can create their own fictitious business or your little one may be starting their own business selling art work, crafts, baked goods or a lemonade stand... whatever the occasion- thi
Subjects:
Grades:
1st - 4th
Types:

Grogu Inspired Math Mystery Pixel Art
This product is a wonderful way for students to drive their math facts through a mystery math picture! This product can be edited, using the directions provided, and used to differentiate math facts for a variety of students and grades. This product can be used on Google Classroom, Google Drive, and in Excel.
Subjects:
Grades:
2nd - 4th
Types:

Mandalorian Inspired Math Mystery Pixel Art
This product is a wonderful way for students to drive their math facts through a mystery math picture! This product can be edited, using the directions provided, and used to differentiate math facts for a variety of students and grades. This product can be used on Google Classroom, Google Drive, and in Excel.
Subjects:
Grades:
2nd - 4th
Types:
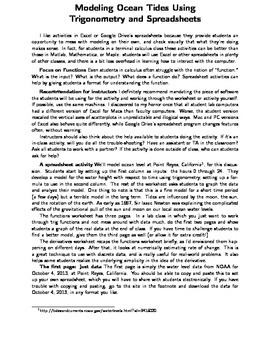
Spreadsheet trig activity: modeling tides
Two spreadsheet activities for use in a computer lab or outside of class, creating and critiquing a trigonometric model for ocean level at Point Reyes, California. Apply trigonometry knowledge and then use numerical methods for rate of change. Real data is used, and students are prompted to think critically about their models.
Subjects:
Grades:
11th - 12th, Higher Education
Types:
CCSS:
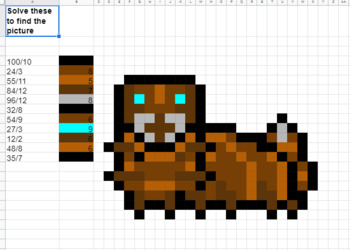
Baby Mothra Inspired Math Mystery Pixel Art
This product is a wonderful way for students to drive their math facts through a mystery math picture! This product can be edited, using the directions provided, and used to differentiate math facts for a variety of students and grades. This product can be used on Google Classroom, Google Drive, and in Excel.
Subjects:
Grades:
3rd - 4th
Types:

Rodan Inspired Math Mystery Pixel Art
This product is a wonderful way for students to drive their math facts through a mystery math picture! This product can be edited, using the directions provided, and used to differentiate math facts for a variety of students and grades. This product can be used on Google Classroom, Google Drive, and in Excel.
Subjects:
Grades:
2nd - 5th
Types:

KyloRen Inspired Math Mystery Pixel Art
This product is a wonderful way for students to drive their math facts through a mystery math picture! This product can be edited, using the directions provided, and used to differentiate math facts for a variety of students and grades. This product can be used on Google Classroom, Google Drive, and in Excel.
Subjects:
Grades:
2nd - 4th
Types:

Luke Skywalker Inspired Math Mystery Pixel Art
This product is a wonderful way for students to drive their math facts through a mystery math picture! This product can be edited, using the directions provided, and used to differentiate math facts for a variety of students and grades. This product can be used on Google Classroom, Google Drive, and in Excel.
Subjects:
Grades:
2nd - 4th
Types:
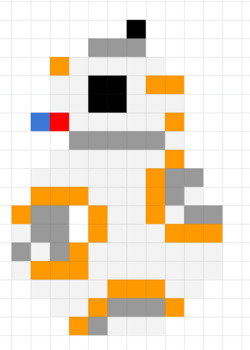
BB8 Inspired Math Mystery Pixel Art
This product is a wonderful way for students to drive their math facts through a mystery math picture! This product can be edited, using the directions provided, and used to differentiate math facts for a variety of students and grades. This product can be used on Google Classroom, Google Drive, and in Excel.
Subjects:
Grades:
3rd - 4th
Types:
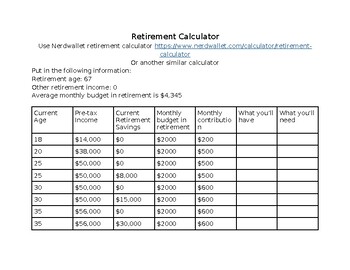
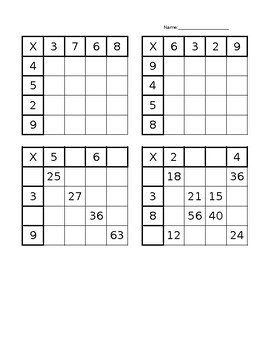
Missing number multiplication grids
This chart will help students learn to read and use a multiplication chart. This one goes up to 9 x 9.
Subjects:
Grades:
3rd - 6th
Types:
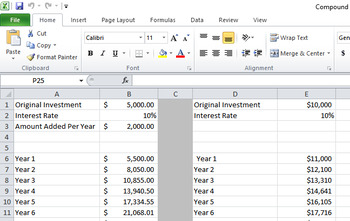
Personal Finance - Calculating Compound Interest Spreadsheet
Show your students the power of compound interest!
This spreadsheet shows how compound interest grows over 50 years in two possible scenarios:
1) How a single investment grow over time.
2) How a single investment, plus money added annually, grows over time.
The spreadsheet allows you to change the original investment amount, the interest rate, or the amount added annually, and to automatically see the change in growth over time. There is no need for you to try to figure out any spreadshee
Subjects:
Grades:
7th - 12th
Types:
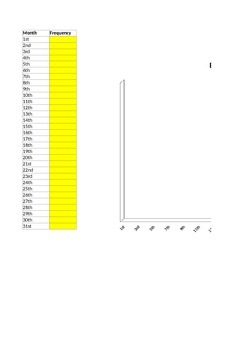
Birthday Frequency Graph - by Day of Month
An interactive Excel spreadsheet to graphically display the frequency of birthdays by day of the month. Simply fill in the yellow cells with the appropriate number and the chart will automatically update.
Subjects:
Grades:
1st - 5th
Types:

Calculating Hourly Pay Spreadsheet
This spreadsheet can easily be converted to Google Sheets or used as an Excel document. This assists students calculating number of hours worked per day, number of hours worked per week and weekly gross pay
Subjects:
Grades:
8th - 12th
Types:
CCSS:
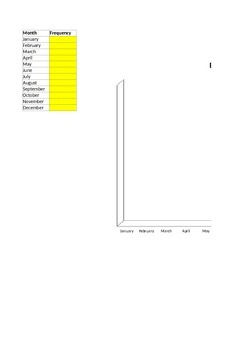
Birthday Frequency Graph - by Month of Year
An interactive Excel spreadsheet to graphically display the frequency of birthdays by month of the year. Simply fill in the yellow cells with the appropriate number and the chart will automatically update.
Subjects:
Grades:
K - 5th
Types:
Showing 1-19 of 19 results


