30 results
Graphing centers for Microsoft Excel
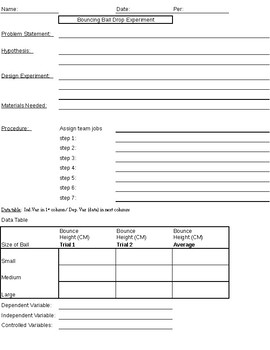
Science: Simple Bouncing Ball Experiment With Data Table & Graph Practice
This simple experiment can be used in open inquiry by giving students three different sized balls and a meter stick so they can design their own experiments. Included (all black & white pages - easy to copy): (1) teacher reference page to give students much or little guidance.(2) pages for students to write a problem statement, hypothesis, experiment design, materials needed, procedure, data table (for independent and dependent variables), an area for a graph, and conclusion. Some Ideas F
Subjects:
Grades:
Not Grade Specific
Types:
Rational Numbers - Super Sleuths - Culminating Activity (Mathematics)
You've finished your unit on Rational Numbers and now you're looking for a culminating activity that's different, fun and challenging at the same time! "Super Sleuths" is just what you're looking for!!Students will use what they've learned about Rational Numbers to track down the evil Dr. Irrational! He's escaped from prison and through a series of challenges, your students will be able to track him down and send him back to prison.Activities include graphing, drawing images in the coordinate
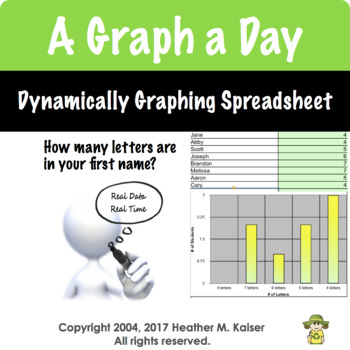
Daily Graph
If you want to integrate technology in a meaningful way, try using the daily graph questions that generate a graph in real time as students respond. This fully editable product works in Numbers, Excel, and Google Sheets.
When downloaded, this Excel spreadsheet contains 180 questions for students to answer. The teacher types their student roster 1 time. As students respond the graph is created dynamically. Teachers can customize the prompts and can upload the file as a Google Sheet that can
Grades:
3rd - 5th
Types:
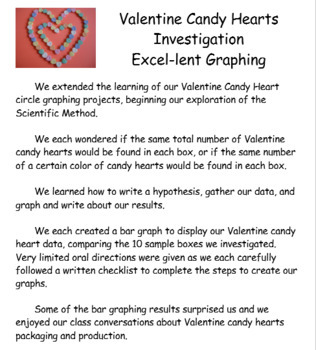
Excel Graphing Valentine Candy Hearts Investigation
#welovecandyheartsThis integrated Math/ Science/ Technology project is a great way to make statistics and probability real, relevant, fun, and delicious!Students will create bar graphs using Excel to display Valentine candy hearts data, as students consider packaging and production of small Valentine candy heart individual boxes. Project file includes sample bulletin board display poster, project directions in individual student checklist form, and rubric to grade the finished graph.Project file
Grades:
5th - 7th
Types:
NGSS:
3-5-ETS1-2
, MS-ETS1-3
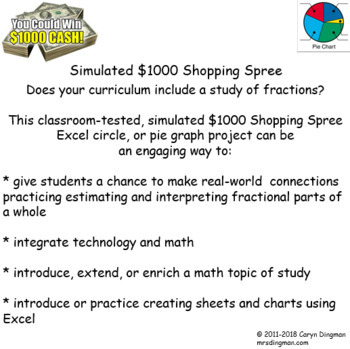
Excel Graphing $1000 Simulated Shopping Spree
Does your curriculum include a study of fractions?This classroom-tested $1000 Simulated Shopping Spree Excel circle, or pie graph project can be an engaging way to:* give students a chance to make real-world connections practicing estimating * interpret fractional parts of a whole in a way that's personal and unique* integrate technology and math* introduce, extend, or enrich a math topic of study* introduce or practice creating sheets and charts using ExcelThis classroom-tested project file in
Subjects:
Grades:
4th - 6th
Types:

Small, Medium, Large Student Graph Paper
Three blank editable excel sheets in small, medium and large
Subjects:
Grades:
Not Grade Specific
Types:
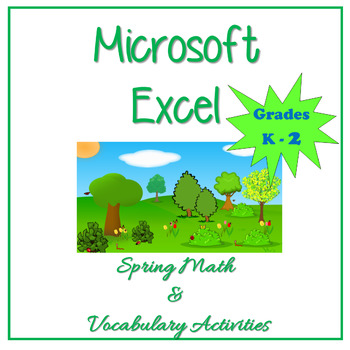
Microsoft Excel Spring Math & Vocabulary Activities
These activities are for students with no prior experience using Microsoft Excel. Spring themed lessons to introduce younger students to using Microsoft Excel. Aligned with Common Core, students will count, graph, answer more or less questions, and either add the numbers manually or by using the AutoSum Function in Microsoft Excel. It is your choice! There are separate directions to teach students how to use the AutoSum Function in Microsoft Excel if you choose. Each spreadsheet has different da
Subjects:
Grades:
K - 2nd
Types:
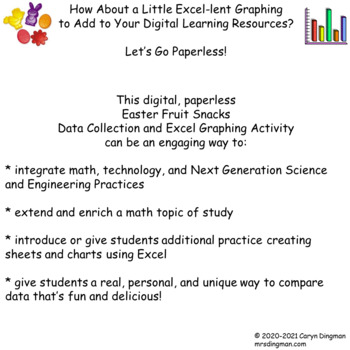
Excel Graphing Easter Fruit Snacks with Digital Student Directions
How About a Little Excel-lent Graphing to Add to Your Digital Learning Resources?Let’s Go Paperless!This digital, paperless Easter Fruit Snacks Data Collection and Excel Graphing Activitycan be an engaging way to:* integrate math, technology, and Next Generation Science and Engineering Practices* extend and enrich a math topic of study* introduce or give students additional practice creating sheets and charts using Excel* give students a real, personal, and unique way to compare data that’s fun

Excel Graphing Planet Weights with Digital Student Directions
Does your curriculum include a study of the solar system and/or forces and motion?Want to give your students a real-world and personal way to practice decimal multiplication?This Planet Weights Excel Project can be an engaging way to:* integrate technology, math, and Next Generation Science and Engineering Practices* introduce, extend, or enrich a math and science topic of study* introduce or practice creating sheets and charts using Excel* give students a chance to make connections across the c
Subjects:
Grades:
3rd - 6th
Types:
NGSS:
5-ESS1-2
, MS-PS2-4
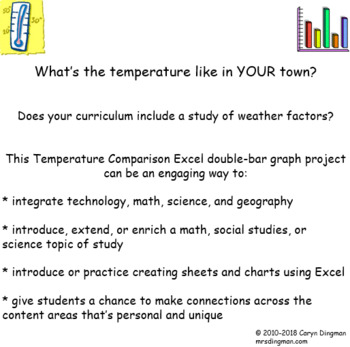
Excel Graphing Temperature Comparison
What's the temperature like in YOUR town? Does your curriculum include a study of weather factors? This Temperature Comparison Excel double-bar graph project can be an engagingway to:* integrate technology, math, science, and geography* introduce, extend, or enrich a math, social studies, or science topic of study* introduce or practice creating sheets and charts using Excel* give students a chance to make connections across the content areasThis classroom-tested project file includes: * student
Grades:
4th - 6th
Types:
NGSS:
5-ESS1-2
, 3-ESS2-1
, 3-ESS2-2
, 5-ESS2-1
, MS-ESS2-6
...
Excel Graphing Lucky Charms Marshmallows
Give your students a real-world chance to compare Lucky Charms cereal marshmallow data in a way that's personal and unique!This Lucky Charms Marshmallows Excel Project can be an engaging way to:* integrate technology* introduce, extend, or enrich a math topic of study* introduce or give students additional practice creating sheets and charts using Excel The classroom-tested product file includes:* student project directions sheet, in checklist form* rubric to score each completed graph* sample b
Grades:
3rd - 6th

Excel Graphing Pulse Rate Comparison
Does your curriculum include a study of the circulatory system? This Pulse Comparison Excel double-bar graph project can be an engaging way to:* integrate technology, math, and science* introduce, extend, or enrich a math or science topic of study* introduce or practice creating sheets and charts using Excel* give students a chance to make connections across the content areasStudents will be encouraged to wonder… Would the time of day and what we were doing affect our pulse rates?Pulses will be

Excel Graphing Valentine Conversation Hearts
Explore Excel circle graphing with a Valentine's Day project that's fun and delicious!Students will create circle, or pie graphs using Excel to display Valentine candy hearts' data. Fractional parts of a whole will be reviewed and discussed as part of the project. Project file includes sample bulletin board display poster, project directions in individual student checklist form, and rubric to grade the finished graph.Project file student directions have been updated for Excel 2016.This project w
Grades:
3rd - 6th
Tracking Daily Weather for Excel and Numbers
Have your students record the daily weather to look for trends across the year. Use the information collected to make predictions about the weather. This product is available as an Excel spreadsheet and as a Numbers file.
Subjects:
Grades:
1st - 8th
Types:
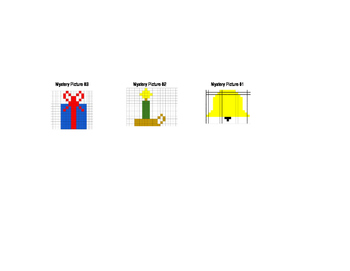
Christmas Coordinate Graphing 1 - Excel
I use this with my computer classes. I have adapted it so that it can be printed out and used without the computer. Excel labels their columns with letters and rows with numbers so those are the coordinates that I have used.
Grades:
3rd - 5th
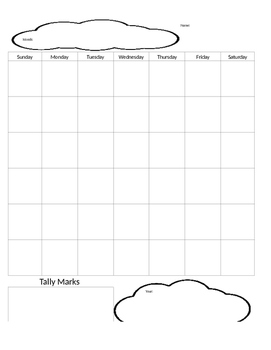
Math Meeting Calendar
Math Meeting Calendar was developed to accompany Saxon's Math Meeting. Sheet 1 Includes:* Month (left empty for practice writing and spelling)*Calendar (left empty for the student to write in the date, 6 rows for the long months)* Tally Marks (for the number of days in the month)* Year (left empty for practice in writing the year)Sheet 2 includes:* Weather Graph (for graphing practice)* Cups (to count coins and practice writing in cents)* Monthly Calendar Pattern (to draw the shape pattern for t
Subjects:
Grades:
PreK - 1st
Types:
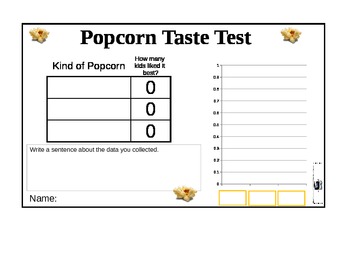
Graphing Flavors of Popcorn
This is an Excel spreadsheet designed for use with first graders. Students sample 3 types of popcorn (butter & salt, chocolate, and candied popcorn), then a class vote is done. Students move the labels onto the data chart and graph. There is space for students to type in the votes and a sentence about their data.
Grades:
K - 1st
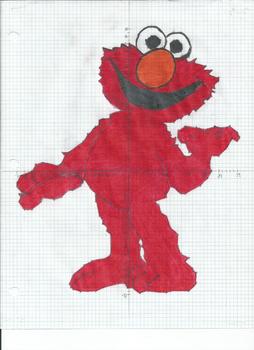
Elmo Coordinate Plane Picture
Students will graph ordered pairs in all 4 quadrants to create a detailed picture of Elmo.
Subjects:
Grades:
6th - 8th
Types:
CCSS:
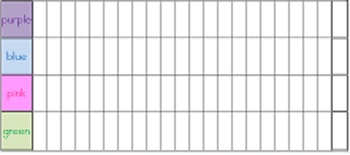
Easter Egg Graphing - Common Core First Grade
Students choose their favorite color Easter Egg (and decorate it too!). Students will collect data using tally marks, then they will organize the data into a representational bar graph. There are simple questions to answer to assess how they analyze the data.
Included: Lesson outline, egg pattern, tally boxes, bar graph, questions.
CCSS.Math.Content.1.MD.C.4 Organize, represent, and interpret data with up to three categories; ask and answer questions about the total number of data points, how
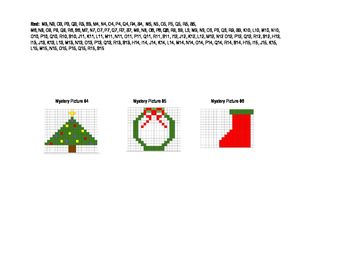
Christmas Coordinate Graphing #2
I use this with my computer courses when introducing spreadsheets. Spreadsheets label columns with the alphabet and rows with numbers so these are the coordinates listed. I did make the spreadsheet template printable for use off of the computer at a center etc.
Grades:
3rd - 6th
Bar Graph for Beginners (editable!)
This is a simple bar graph that will display basic data. It is editable so you can change the title & choices to suit your lesson. You can also adjust the width of the columns in order to add more choices for voting. If you fill in the data, it can even be used as an assessment. It is an excel document, so be mindful of the print area.
Subjects:
Grades:
1st - 2nd
Types:
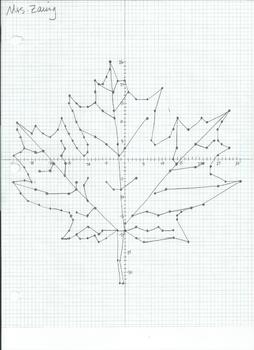
Leaf Coordinate Plane Picture
Students will graph ordered pairs on a 4-quadrant coordinate plane. When connected, the points will form a detailed picture of a leaf with veins.
Subjects:
Grades:
6th - 8th
Types:
CCSS:
Bar Graph for Survey Questions
Survey the class giving them 2 options. (ie: Are you right-handed or left-handed? Do you like Winter or Summer better? Do you like white chocolate or milk chocolate better?). Use tally marks to record each student's response. Transfer that data to this ready-made graph. Students write a title and labels, analyze the class data to create a bar graph, then answer simple questions. The graph is generic enough to use with any 2 choice survey question, but detailed enough to be effective. (There are
Halloween Mystery Pictures #2
This is designed to be used with a spreadsheet. It has been arranged for print out use as well. Spreadsheets use the alphabet to label their columns and numbers to label their rows.
Grades:
2nd - 5th
Showing 1-24 of 30 results


