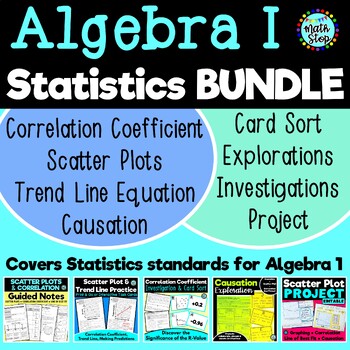
Algebra 1 Statistics Bundle Scatter Plot Trend Line Correlation Coefficient
Products in this Bundle (4)
Description
Grab this bundle for your Algebra 1 Statistics Linear Regression Unit that covers discovering the significance of the correlation coefficient/r-value, scatter plots and making predictions using the trend line/line of best fit, and causation. Then wrap up your unit with the included project. Students choose their own topic and analyze their data. This particular resource is editable (the other three are not). Check out each resource below to see if this bundle fits your needs.
Correlation Coefficient R Value Investigation and Card Sort
Students will first investigate the significance of the correlation coefficient, gaining an understanding that the r-value helps to determine the strength and direction of the scatter plot. For the Investigation, students will:
• Practice graphing a scatter plot by hand.
• Practice using a graphing calculator to find the r-value.
• Investigate various scatter plots to understand the significance of the correlation coefficient (what the value means in describing the scatterplot’s strength and direction).
This resource also includes a card sort so that students can demonstrate their understanding of the correlation coefficient. They use the cards to match each given scatterplot with its most reasonable correlation coefficient.
An answer key is provided for both activities.
Scatter Plot Trend Line of Best Fit Correlation Coefficient Practice Task Cards
Students are given five different scatter plot scenarios (for example, temperature and the number of ice creams sold) with a table and graph already created. Their job is to use a calculator to find the correlation coefficient and equation of the line of best fit. Then for each one, they are asked to:
➤ State the correlation coefficient/r-value.
➤ Describe the strength and direction of the scatter plot.
➤ Find the equation of the line of best fit/trend line.
➤ Draw the line of best fit on the scatter plot.
➤ Predict a certain value using the trend line equation.
The possibilities are not exclusive to the following, but do include:
1. A PRINT & GO OPTION that has all five scenarios and questions/prompts on a front and back page.
OR
2. A TASK CARD OPTION, where I like to have students put each scenario separately in a plastic sleeve and use a dry erase marker to answer the questions and create the line of best fit on the scatter plot graph. Once they have completed one scenario and gotten it checked, they trade it out for the next.
This resource includes five scenarios/task cards (the print & go option or the task card option), and an answer key.
Causation vs Correlation Collaborative Exploration Activity
Practice causation vs correlation, sketching scatter plots, and estimating the correlation coefficient. Looking for a great way to get students collaborating, discussing and debating? This activity provides students with 10 different situations in which they will need to work in their groups to sketch an appropriate scatter plot, estimate a reasonable correlation coefficient, and decide if the situation implies causation (and explain their decision). In most cases, the situations are debatable, so students should be encouraged to work in their small group (suggested 3 or 4 students) to discuss and justify each answer. Each of the 10 situations are provided on separate pages, to make it easy to post around the room to allow students to walk around the room to complete each letter.
NOTE: Because their are so many possible answers, and situations are debatable, an answer key is not included.
Scatter Plot Project EDITABLE | Correlation Causation Trend Line
A great project to assess students' mastery of scatter plots and bivariant data, correlation coefficient, association, line of best fit, the equation of the line of best fit, and causation. Students are asked to research or collect their own data on the topic of their choice (for example: find the current age and yearly salaries of 10 famous actors, find the height and shoe sizes of 10 different students, or measure the arm span and height of 10 different people). They will display and include these things, and also include a reflection. The reflection allows students to analyze their results, including the strength of the correlation and whether their data implies causation or not. However, if you need to customize the directions, reflection, list of items to display or the rubric in anyway, the file is completely editable.


