The Survey Says -- Quantitative Questionnaire - 21st Century Math Project
- Zip
- Google Apps™

What educators are saying
Also included in
- The project is the core of what I have built my classroom around. Scaffolding learners to real world projects. This bundle includes the 105+ math projects I have written. This is over 2,700 pages of content.21st Century Math Projects each scaffold through an authentic context and math skill buildingPrice $395.00Original Price $564.00Save $169.00
- This is a selection of my Data Displays & Analysis resources all in a money saving Essential Bundle! You save significant money and time versus purchasing these separately!Essential Bundles are designed to give you everything you need to rock your unit. Warmups, Notes, Activities, Games, Exit TiPrice $35.00Original Price $146.50Save $111.50
- 12 of my best selling projects/units all in an organized money saving bundle! These engaging, student/teacher approved math projects that provide rigor, relevance, and cross-curricular content altogether. Check out the preview to see the alignment to the Common Core Standards! I have each of these pPrice $45.00Original Price $61.00Save $16.00
Learning Objective
Students will practice data collection, question writing, and data analysis in the authentic context of polling. Students answer the question, “How can you create and administer a survey that meets professional guidelines?”
Description
With an influx of data and statistics standards into different levels of the Common Core, a greater emphasis is placed on students understanding data and administering questionnaires (now in the new Algebra 2). This 21st Century Math Project intends to help provide an outline and structure to a project that often has a great deal of freedom with it... perhaps too much freedom.
In this project, students will understand different quantitative research question types, critique poorly asked questions, practice writing structured questions and finally planning their own full-fledged questionnaire until they find out they have to --
-- do a statistical analysis of each survey question AND write a report based on their findings. Push them to do what graduate students and professors do every day. Seek random samples, calculate raw data, analyze the results and report their findings.
All in one 21st Century Math Project.
In this 20 page document you will be given a mapping to the Content Standards, an outline for how to implement the project, and handout resources for students to use. Check the preview to see every document that's included. ***THIS PRODUCT HAS BEEN UPDATED WITH A GOOGLE SLIDES INTERACTIVE VERSION INCLUDED. REDOWNLOAD IF YOU HAVE IT ALREADY***
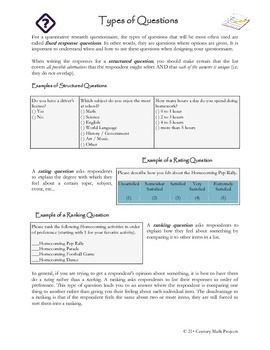
-- In "Quantitative Research Questionnaire", students will understand different quantitative research question types, critique poorly asked questions, and practice writing structured questions.
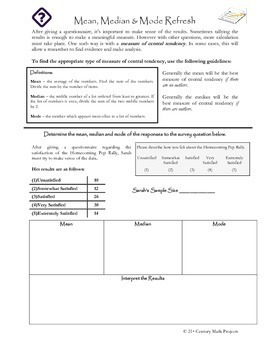
-- In "Mean, Median, and Mode Refresh", students will have use a dataset to practice these old skills.
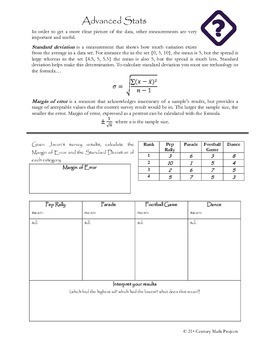
-- In "Advanced Stats", students will practice questions that require standard deviation and margin of error.
-- In "Questionnaire Planning Guide", students will use this to plan their own questionnaires, compute their raw data and write a report on their findings. and finally plan their own full-fledged questionnaire. Then they'll find out they have to do a statistical analysis of each survey question AND write a report based on their findings. Push them to do what graduate students and professors do every day! Seek random samples, calculate raw data, analyze the results and report their findings.
You may be interested in the following discounted bundles. SAVE $$$!
•21st Century Math Projects -- All the Projects
•Algebra 2 - Pre-Calculus Projects Starter Bundle
Need an Entire Curriculum?
•21st Century Pre-Algebra –- the Entire Curriculum
•21st Century Algebra 2 / Pre-Calculus –- the Entire Curriculum
For more tips, tricks and ideas check out the Clark Creative Education Blog
And join our community where I post ideas, anecdotes, elaborations & every once in a while I pass out TPT gift cards! And jokes! I do jokes too!

