142 results
Graphing lecture microsofts
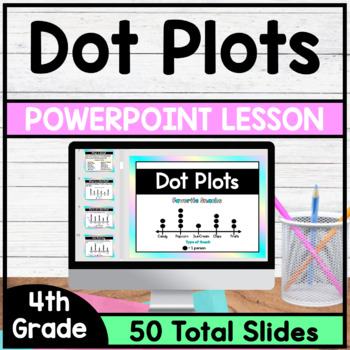
Dot Plots - PowerPoint Lesson
This is a PowerPoint Lesson that focuses on Dot Plots. This PowerPoint Lesson goes through the complete lesson plan cycle. In this lesson students will learn about the parts of a dot plot and will understand how to summarize data on a dot plot. *This PowerPoint Lesson has everything you need to teach a lesson. Just download and begin teaching. This lesson includes Direct Instruction Slides, Guided Practice Slides and Independent Practice Slides. (Printable Version of Guided Practice Questions
Grades:
4th
CCSS:
Also included in: 4th Grade Math PowerPoint Lessons - Bundle
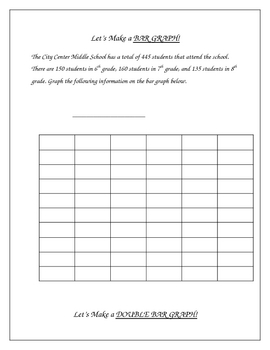
Constructing Graphs - Bar Graphs, Line Graphs, Circle Graphs
**I revised the numbers in the pie graph on this from the first version, these amounts are much more friendly** This activity includes construction of a bar graph, double bar graph, line graph, double line graph, and a circle graph.I put this together after being frustrated about not being able to find any graphing activities appropriate for intermediate grades that would allow me to make graphs with the class on my smartboard. I needed some examples to demonstrate how to take data and create a
Subjects:
Grades:
3rd - 10th, Adult Education
Types:
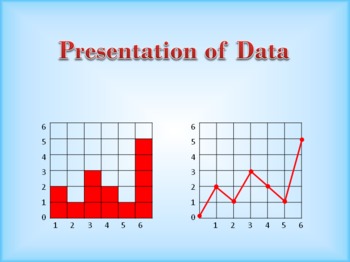
Tables, bar charts, and graphs - how to construct them in order to present data
By the time students reach middle school, they have learned how to fill in the data on a table, bar chart, and graph, but they still need to learn how to create (construct, make, or draw) one from scratch. This is a PowerPoint presentation, with lecture notes and associated worksheets, that demonstrates how to present data clearly, by constructing tables, bar charts, and graphs from raw data. It covers topics such as the relationship between independent and dependent information (variables), a m
Subjects:
Grades:
7th - 10th
Algebra 1 Lesson BUNDLE - Systems of Equations
This unit bundle contains lessons over:Graphing Systems of EquationsSolving Systems Using SubstitutionElimination Using Addition & SubtractionElimination Using MultiplicationSystems of InequalitiesEach lesson is done with a bohemian style color pallet; all material is editable, if you need to adjust to your teaching style or your classroom curriculum.
Grades:
9th - 12th
CCSS:
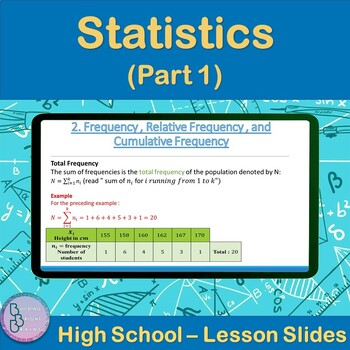
Statistics Part 1 | High School Math PowerPoint Lesson Slides
Are you teaching your High School students about Statistics? Plenty of examples and application exercises are included. You can also easily convert this to a Google Slides lesson by dragging it into your Google Drive.What is included?✦ 30 total slides for notes, examples and applications.✦ All steps are animated to allow the teacher to explain them gradually. Throughout the Lesson, students will be introduced to the following:✦ Statistics Vocabulary✦ Frequency , Relative Frequency , and Cumulati
Subjects:
Grades:
10th - 12th, Higher Education
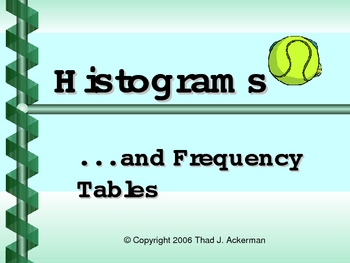
Histograms and Frequency Tables (Powerpoint) for Busy Teachers
This powerpoint presentation introduces the concept of histograms and frequency tables.
Clipart, sounds, and animation are used sparingly and effectively to help illustrate points without being distracting. This powerpoint presentation has been extensively refined using faculty AND student input and feedback.
Definitions of histogram, interval, frequency table, and frequency are all presented. The progression from a frequency table to a completed histogram is illustrated and animated using
Subjects:
Grades:
4th - 12th, Higher Education, Adult Education
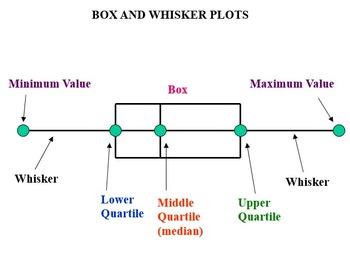
Graphing Galore! (PowerPoint presentation on data and graphing)
This is a PowerPoint presentation loaded with lots of graphing and data information. In this presentation students learn vocabulary, how to organize data, the difference between different types of graphs, how to set up different graphs, and there are examples for students to try on their own in order to check for understanding. This presentation includes the following information:
--Mean, Median, Mode, Range
--Outliers
--Line Plots
--Frequency Tables
--Relative Frequency
--Histograms
--Stem &a
Subjects:
Grades:
6th - 9th
Introduction to Functions
A power-point presentation about "Graphing Functions". Slides show other terms associated with functions, provide student friendly descriptions of terms, pictures, examples, video links, etc.
Grades:
6th - 9th
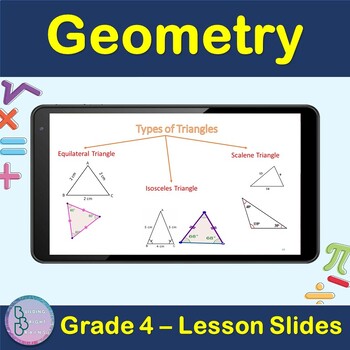
Geometry | 4th Grade PowerPoint Lesson Slides Line Circle polygon Triangle
Are you teaching your students about Geometry For 4th Grade? Plenty of examples and application exercises are included. You can also easily convert this to a Google Slides lesson by dragging it into your Google Drive.What is included?✦ 49 total slides for notes, examples and applications.✦ All steps are animated to allow the teacher to explain them gradually. At the end of the lesson, students will be able to Apply✦ Point, Line, Line segment✦ Angles, Parallel and perpendicular lines✦ Circles✦ po
Grades:
3rd - 5th
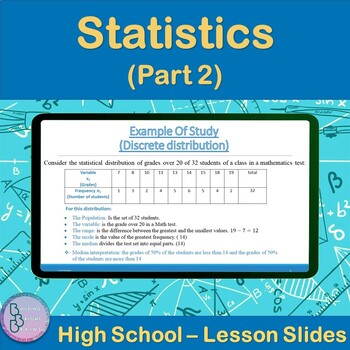
Statistics Part 2 | High School Math PowerPoint Lesson Slides
Are you teaching your High School students about Statistics (Part 2)? Plenty of examples and application exercises are included. You can also easily convert this to a Google Slides lesson by dragging it into your Google Drive.What is included?✦ 18 total slides for notes, examples and applications.✦ All steps are animated to allow the teacher to explain them gradually. Throughout the Lesson, students will be introduced to the following:✦ Statistical Vocabulary✦ Discrete distribution✦ Continuous d
Subjects:
Grades:
10th - 12th, Higher Education
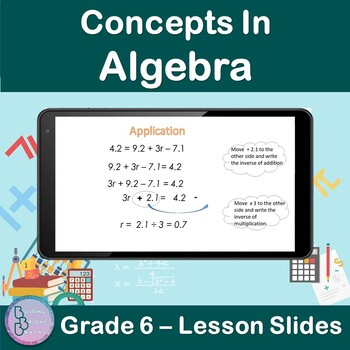
Concepts in Algebra | 6th Grade PowerPoint Lesson Slides | Algebraic Patterns
Are you teaching your students about Concepts In Algebra For 6th Grade? Plenty of examples and application exercises are included. You can also easily convert this to a Google Slides lesson by dragging it into your Google Drive.What is included?✦ 47 total slides for notes, examples and applications.✦ All steps are animated to allow the teacher to explain them gradually. At the end of the lesson, students will be able to✦ Solve Algebraic Patterns ✦ Solve Two-Step Equations✦ Solve Addition and Sub
Grades:
5th - 7th
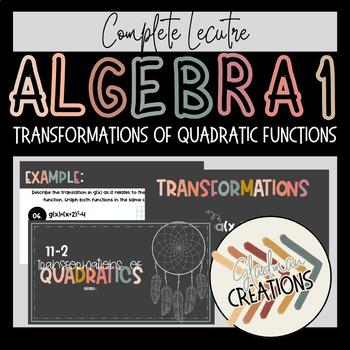
Algebra 1 Lesson - Transformations of Quadratic Functions
This complete lesson can be used with any curriculum and each student will be able toApply translations to quadratic functions.Apply dilations to quadratic functions.Use transformations to identify quadratic functions from graphs and write equations of quadratic functions.This lesson contains vocabulary, processes and progressively more difficult examples for you to guide your students through to aid in their understanding.All material is editable, if you need to adjust to your teaching style or
Grades:
9th - 12th
CCSS:
Also included in: Algebra 1 Lesson BUNDLE - Quadratic Functions
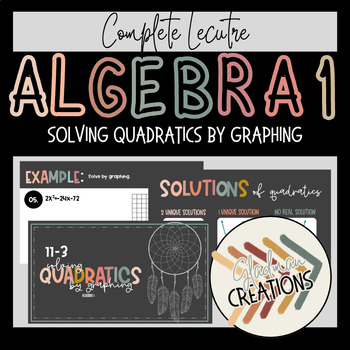
Algebra 1 Lesson - Solving Quadratics by Graphing
This complete lesson can be used with any curriculum and each student will be able toSolve quadratic equations by graphing.This lesson contains vocabulary, processes and progressively more difficult examples for you to guide your students through to aid in their understanding.All material is editable, if you need to adjust to your teaching style or your classroom curriculum.
Grades:
9th - 12th
CCSS:
Also included in: Algebra 1 Lesson BUNDLE - Quadratic Functions
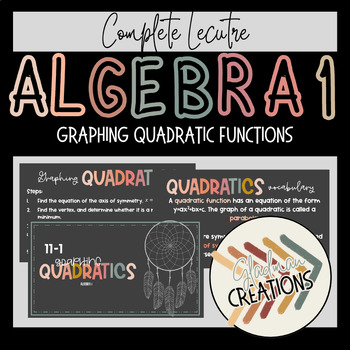
Algebra 1 Lesson - Graphing Quadratic Functions
This complete lesson can be used with any curriculum and each student will be able toAnalyze graphs of quadratic functions.Graph quadratic functions by using key features and tables.Use graphing calculators to analyze key features of quadratic functions.This lesson contains vocabulary, processes and progressively more difficult examples for you to guide your students through to aid in their understanding.All material is editable, if you need to adjust to your teaching style or your classroom cur
Grades:
9th - 12th
CCSS:
Also included in: Algebra 1 Lesson BUNDLE - Quadratic Functions
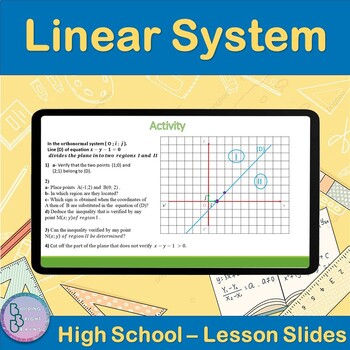
Linear System | High School Math PowerPoint Lesson Slides
Are you teaching your High School students about Linear System? Plenty of examples and application exercises are included. You can also easily convert this to a Google Slides lesson by dragging it into your Google Drive.What is included?✦ 17 total slides for notes, examples and applications.✦ All steps are animated to allow the teacher to explain them gradually. Throughout the Lesson, students will be introduced to the following:✦ Algebraic method of solving✦ Substitution Method ✦ Comparison Met
Grades:
10th - 12th, Higher Education

Question Exploration: What Are the Solar Activity Sunspot Cycles?
What are the solar activity sunspot cycles? Sunspots increase and decrease through an average cycle of 11 years. This Question Exploration helps Ss explain how the spotless Sun turns dark, releasing solar flares and coronal mass ejections (CMEs).Question Exploration Routine is an instructional methods that teachers can use to help a diverse student population understand a body of content information by carefully answering a critical question to arrive at a main idea answer. The Concept Comparis
Subjects:
Grades:
7th - 12th, Higher Education
Types:
NGSS:
HS-ESS1-1
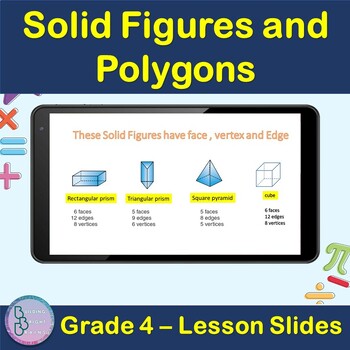
Solid Figures and Polygons | 4th Grade PowerPoint Lesson Slides
Are you teaching your students about Solid Figures and Polygons For 4th Grade? Plenty of examples and application exercises are included. You can also easily convert this to a Google Slides lesson by dragging it into your Google Drive.What is included?✦ 11 total slides for notes, examples and applications.✦ All steps are animated to allow the teacher to explain them gradually. At the end of the lesson, students will be able to ✦ Define Polygons✦ Define Solid figures✦ Understand Solid figures Fac
Grades:
3rd - 5th
Data Representation Powerpoint
The presentation contains: 1) TALLY MARKS Learning Objectives. Definition of a tally mark. Uses of tally mark. How to count a tally mark. Tally Mark Chart. Construction of a tally mark table with an example. Application on real life problems on tally mark. Read and Interpret a tally mark table.The presentation contains: 2) FREQUENCY DISTRIBUTION TABLEDefinition of a Frequency Distribution Table. Types of Frequency Distribution Table: a) Discrete Frequency Distribution Table (Ungrouped).b) C
Subjects:
Grades:
1st - 10th, Higher Education, Staff
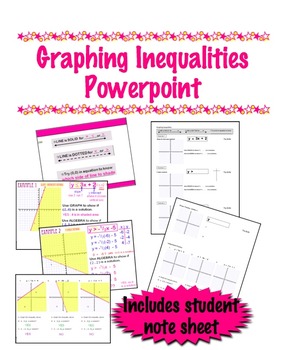
Graphing Inequalities Powerpoint with Student Notes Sheet
This is a powerpoint file with an editable double-sided page student notes. ( WORD file)
The zip file includes:
A 64 slide powerpoint that leads the lesson
A double-sided student notes sheet to work along with the presentation
A page of "group" problems
I originally made this on my interactive board, then took screen shots to make this powerpoint for a colleague. That's why there are so many slides (66!). Instead of annimation, each new slide adds a step of the problem.
The Powerpoint les
Grades:
8th - 11th
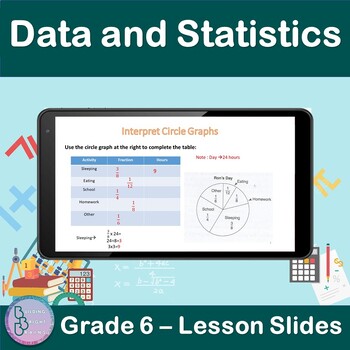
Data and Statistics | 6th Grade PowerPoint Lesson Slides | Circle Graphs
Are you teaching your students about Data and Statistics For 6th Grade? Plenty of examples and application exercises are included. You can also easily convert this to a Google Slides lesson by dragging it into your Google Drive.What is included?✦ 9 total slides for notes, examples and applications.✦ All steps are animated to allow the teacher to explain them gradually. At the end of the lesson, students will be able to✦ Interpret Circle Graphs.✦ Use a circle graph to complete s table.✦ Use a cir
Subjects:
Grades:
5th - 7th
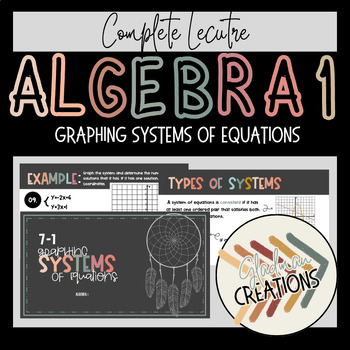
Algebra 1 Lesson - Graphing Systems of Equations
This complete lesson can be used with any curriculum and each student will be able toDetermine the number of solutions of a system of linear equations.Solve systems of equations by graphing.Solve linear equations by graphing systems of equations.This lesson is done with a bohemian style color pallet; all material is editable, if you need to adjust to your teaching style or your classroom curriculum.
Grades:
9th - 12th
CCSS:
Also included in: Algebra 1 Lesson BUNDLE - Systems of Equations
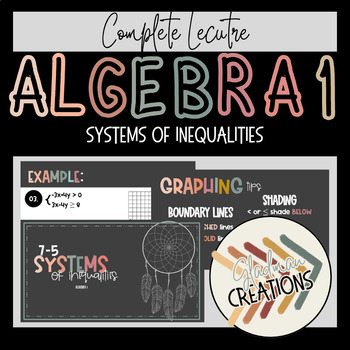
Algebra 1 Lesson - Systems of Inequalities
This complete lesson can be used with any curriculum and each student will be able toSolve systems of linear inequalities by graphing.This lesson is done with a bohemian style color pallet; all material is editable, if you need to adjust to your teaching style or your classroom curriculum.
Grades:
9th - 12th
CCSS:
Also included in: Algebra 1 Lesson BUNDLE - Systems of Equations
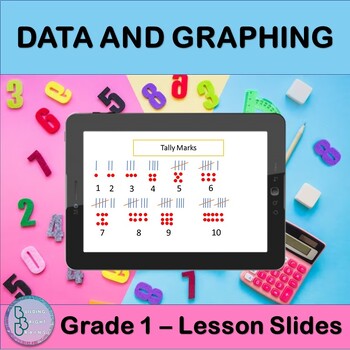
Data and Graphing | PowerPoint Lesson Slides Tally Chart Pictograph Bar Graph
Are you teaching your students about Data and Graphing? This resource is great for you for First Grade! Plenty of examples and application exercises are included. You can also easily convert this to a Google Slides lesson by dragging it into your Google Drive.What is included?✦ 6 total slides for notes, examples and applications.✦ All steps are animated to allow the teacher to explain them gradually. At the end of the lesson, students will be able to ✦ Make a Tally Chart✦ Make a Pictograph✦ Read
Grades:
1st - 2nd
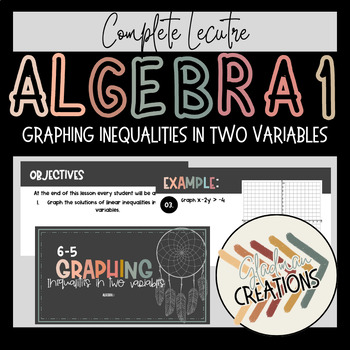
Algebra 1 Lesson - Graphing Inequalities in Two Variables
This complete lesson can be used with any curriculum and each student will be able toGraph the solutions of linear inequalities in two variables.This lesson is done with a bohemian style color pallet; all material is editable, if you need to adjust to your teaching style or your classroom curriculum.
Grades:
9th - 12th
CCSS:
Also included in: Algebra 1 Lesson BUNDLE - Linear Inequalities
Showing 1-24 of 142 results


