208 results
Graphing study guide microsofts
Making Science Charts and Graphs
A simplified look at making charts and organizing data in science.
-Data Charts
-Circle Graphs
-Bar Graphs
-Line Graphs
-Key Vocabulary List
-Quiz/Assessment
-Activity - Practice
-Teacher answer key for quiz and activity
Thanks for taking the time to stop by my store!
Mrs. Degs
Teaching Science Well
Blog: http://teachingsciencewell.wordpress.com/
Facebook: https://www.facebook.com/TeachingScienceWell
TPT: http://www.teacherspayteachers.com/Store/Teaching-Science-Well-Science-Resources
Pi
Subjects:
Grades:
3rd - 10th
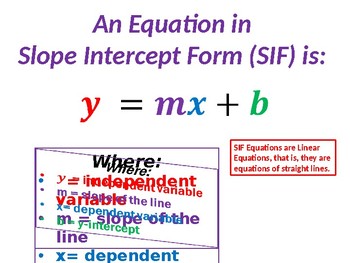
Introduction to Slope Intercept Form (SIF) of Equation including Graphing
This MS PowerPoint presentation provides an easy-to-understand and classroom-tested technique for understanding the Slope Intercept Form (SIF) of linear equation. I have used this presentation multiple times in my general 8th grade math classes and as a refresher in my Math 1/Algebra 1 classes. The solution summaries and techniques for 3 different example equations are provided. Each one is fully animated to help the students remember the important concepts and to remain focused while reviewi
Subjects:
Grades:
7th - 10th
CCSS:
Also included in: Math 1 / Algebra 1 Bundle - Unit 2 Linear Functions
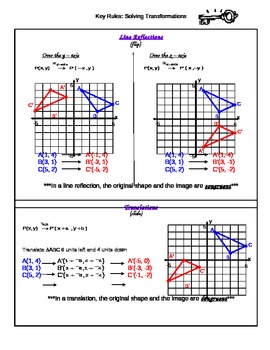
Transformations: Key Rules
This sheet shows the "Key Rules" to common transformations; reflections over the x-axis, reflection over the y-axis, reflections over the line y = x and y = -x, translation, rotation of 90 degrees with a center at the origin rotation of 180 degrees with a center at the origin, rotation of 90 degrees clockwise with a center at the origin, and dilation with a center at the origin and dilations with a center not at the origin. This sheet shows pictures of each transformation and describes how their
Grades:
8th
Types:
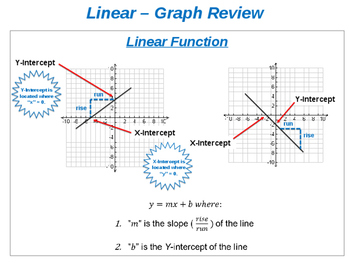
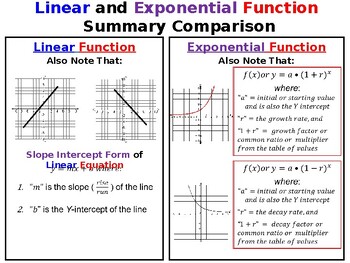
Comparing Linear, Exponential and Quadratic Functions (Equation, Table & Graph)
This PowerPoint (ppt) presentation reviews the methods and steps that students can use to determine whether a function represents a linear, exponential or quadratic relationship. I use this ppt in my Math I (Algebra I) classes immediately after I cover the units on linear, exponential and quadratic functions, thus, it is classroom tested. It is a fully animated ppt presentation and also includes eight (8) tables at the end for the students to complete on their copy of the slides as the teacher
Subjects:
Grades:
9th - 10th
CCSS:
Also included in: Math 1 / Algebra 1 Bundle - Unit 8 General Functions
Math 3/Alg 2 Bundle-Unit 1 Intro to Functions (Linear, AV, Piecewise) & Inverses
This bundle includes various instructional MS PowerPoint (PPT) slidepacks that I initially use when covering the content area titled: Introduction to Functions including Linear, Absolute Value, Piecewise Functions and Inverse Functions. The following slidepacks are included in this bundle:Introduction to FunctionsKey Characteristics of FunctionsLinear Function TransformationsAbsolute Value Function TransformationsAbsolute Value Equation Solution SummaryPiecewise Function Solution SummaryInverse
Subjects:
Grades:
10th - 12th
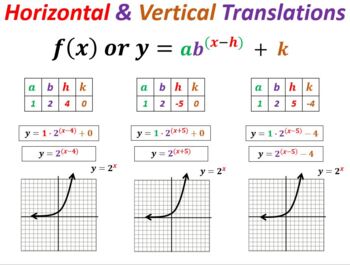
Math 2&3 / Algebra 2 / Precalculus Function Bundle-All Functions Transformations
This bundle includes eleven (11) separate MS PowerPoint presentation slide packs that review the transformations associated with the following eleven (11) separate functions: Absolute Value Function TransformationsLinear Function Transformations Quadratic Function TransformationsExponential Function TransformationsCubic Polynomial TransformationsQuartic Polynomial Function TransformationsLogarithmic Function TransformationsRational Function TransformationsRadical (Square Root) Functions Transfor
Subjects:
Grades:
9th - 12th
CCSS:
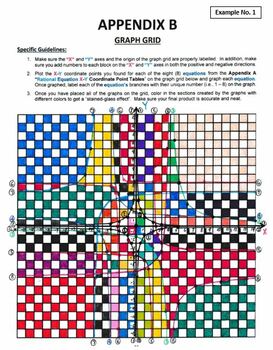
Rational Functions Calculation and Graphing Project
PLEASE NOTE: THE PREVIEW VERSION OF THIS PRODUCT IS THE ACTUAL "STUDENT VERSION" AND DOES NOT INCLUDE ANY OF THE ANSWERS TO THE PROBLEMS. THE PRODUCT VERSION INCLUDES DETAILED ANSWERS TO ALL OF THE PROBLEMS FOR THE PROJECT.This project activity involves the calculation, graphing and coloring of basic rational functions/equations. I have my Algebra 2, Math 3 and Precalculus students complete this project toward the end of the unit on rational functions. As noted in the TpT "Preview" section o
Subjects:
Grades:
10th - 12th
Types:
CCSS:
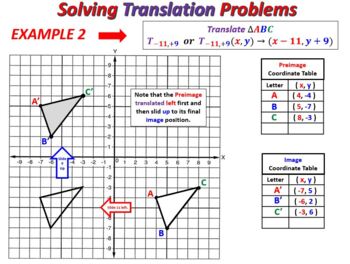
Math 2 / Geometry Bundle - Unit 9 Transformations
This bundle includes various instructional MS PowerPoint (PPT) slidepacks that I initially use when covering the Math 2 / Geometry content area titled: Unit 9 - Transformations. The following slidepacks are included in this bundle:Geometric TranslationsGeometric ReflectionsGeometric RotationsGeometric DilationsThe MS PPT resources noted above are highly animated slidepacks that are designed to keep the students alert and focused. They include detailed solution steps to assist the students in t
Grades:
9th - 12th
CCSS:
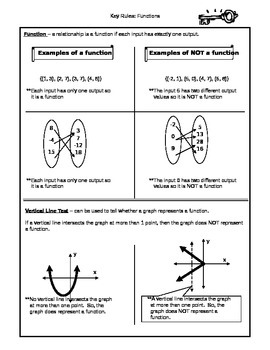
Linear vs Nonlinear and Functions Key Rules
This sheet shows the "Key Rules" to determine if a relationship is a function. It includes mappings, order pairs, and graphs. It also shows the "Key Rules" to determine if a relationship is linear or nonlinear. It includes equations, charts and graphs. I pass this out to my students at the end of the Functions chapter to help them study.
Subjects:
Grades:
8th
Types:
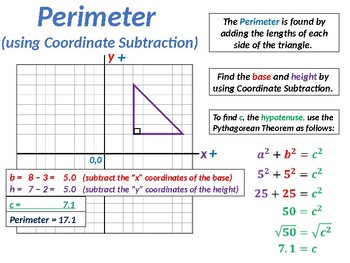
Perimeter and Area in the Coordinate Plane Summay
I use this MS PowerPoint presentation file in my 8th grade Pre-Algebra and 9th grade Math I classes to initiate our study of the methods that can be used to calculate the perimeter and area of 2-D shapes in the coordinate plane. It includes the review of 2 methods I use to compute the side lengths of various shapes (triangles, rectangles, etc.) on a graph grid. It is a totally animated ppt file and is easy for students to understand the concepts. Any of the ppt animations can be modified as d
Grades:
8th - 10th
CCSS:
Also included in: Math 1 / Algebra 1 Bundle - Unit 10 Connecting Algebra and Geometry
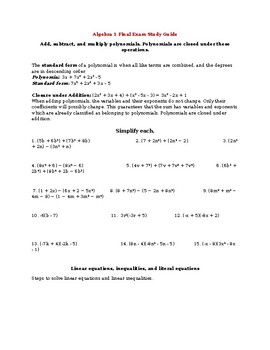
Algebra 1 Final Exam Study Guide and 89 Practice Problems
This Algebra 1 Final Exam study guide has notes, definitions, and 89 practice problems. The 89 practice problems cover the concepts from Algebra 1. The problems include graphs, word problems, equations, and expressions. The answer key for the 89 problems is also provided. The document is in word format so it can be easily adjusted or copied.
Grades:
8th - 9th
Types:
CCSS:
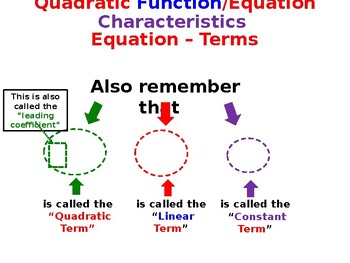
Introduction to Quadratic Functions and Equations
This MS PowerPoint slide presentation provides an easy-to-understand and classroom-tested introduction to Quadratic Functions and Equations. I typically review this slidepack with my 8th Grade, Algebra 1, Math 1 and Math 2 students prior to starting the unit on Quadratics.It is a highly organized and structured instructional slidepack and includes ten (10) slides that describe Quadratic Functions and Equations using the formats of an Equation, Graph and Table. It is fully animated to keep the
Grades:
7th - 10th
CCSS:
Analyzing Linear & Exponential Functions with Technology Slidepack incl Videos
This MS PowerPoint presentation covers the basics of "Analyzing Linear and Exponential Functions with Technology"In this slidepack, I review the use of the following technology in analyzing and solving linear functions which is part of the Math 1 curriculum: TI-84 Graphing Calculator Desmos Graphing CalculatorThe slidepack is divided into the following 3 Parts:Part 1 - Equation ReviewPart 2 - Graph ReviewPart 3 - Table ReviewPart 1 listed above provides an overview and comparison of the
Grades:
8th - 11th
Solving Systems of Linear Equations and Inequalities Word Problems
This MS PowerPoint (ppt) slide pack covers the methods and steps that students can use to solve systems of linear equations and inequality word problems. The slidepack begins with a review of the 7-step word problem solving technique that I have my students learn and use. A template of the word problem solving steps and method is also provided and reviewed. Several slides are then reviewed that discuss the concepts associated with the systems of linear equations and inequalities. I typically
Subjects:
Grades:
8th - 11th
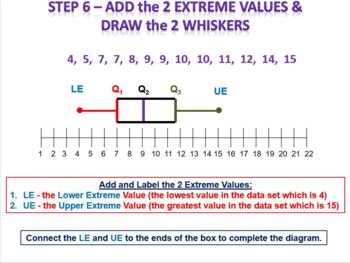
Math 1 / Algebra 1 Bundle - Unit 9 Statistical Measures and Data Analysis
This bundle includes various instructional MS PowerPoint (PPT) slidepacks that I initially use when covering the Math 1/Algebra 1 content area titled: Unit 9 - Statistical Measures and Data Analysis. The following slidepacks are included in this bundle:Box and Whisker Plot Analysis and Construction including Outliers General Statistics - Mean, Median, Mode, Range and Mean Absolute Deviation Mean, Median, Mode, Range and Standard Deviation SummaryScatterplots and Correlation SummaryTwo Way Frequ
Subjects:
Grades:
9th - 12th

Complete Sentences & Sentence Fragments / A Grammar Lesson with Exercises
This presentation is a grammar lesson for elementary students, and it guides them to recognize complete sentences and faulty fragments. This presentation also offers students the opportunity to practice the rules that they have learned through an exercise about sentences and sentence fragments.
Subjects:
Grades:
4th - 6th

Concept Comparison: Graphs in Science (Categorical vs Numerical)
How do scientists use graphs? This concept comparison helps students contrast bar graphs, pie charts and line graphs created from categorical and numerical data. The recall device uses DRY MIX and TRAILS as acronyms to help Ss remember how variables are plotted on a graph, and standard format for a graph. The frame comparison helps students contrast rate of change, slope shape and written relationships of functions (y vs. x; y vs. x^2; y vs. 1/x, and so on). THREE (3) activities are included:ha
Subjects:
Grades:
6th - 12th
NGSS:
HS-ETS1-3
, MS-ETS1-3
Also included in: StayGiant Physics Bundle: Measurement
Analyzing Linear Functions with an Equation, Graph or Table
This MS PPT slidepack provides an extremely comprehensive review and analysis of linear functions using an equation, graph or table associated with the function. The analysis that is included in this slidepack does not use technology, but basic linear equation principles. A separate slidepack covers the use of technology to analyze linear functions and can be purchased by going to my TpT webpage titled "Priceless Math".This slidepack is very detailed and it is recommended that it be divided in
Subjects:
Grades:
7th - 10th
CCSS:
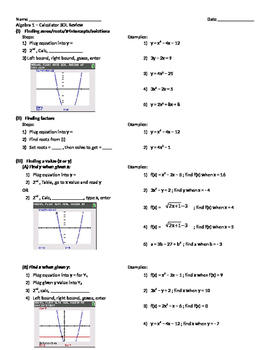
Algebra 1 Calculator Review (TI-84)
Comprehensive review of all graphing calculator concepts taught through the Algebra 1 course. Review concepts include finding roots, factors, values (x or y), y-intercept, mean, standard deviation, line/curve of best fit, and finding solutions to systems of equations. The review include steps and screenshots of the calculator.
Subjects:
Grades:
7th - 12th, Higher Education, Adult Education
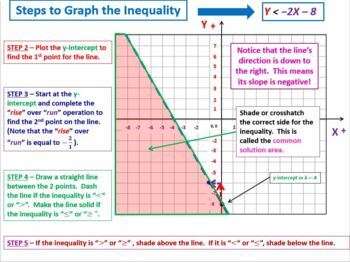
Math 2 / Algebra 1 & 2 Bundle - Unit 1 Functions, Equations and Inequalities
This bundle includes various instructional MS PowerPoint (PPT) slidepacks that I initially use when covering the Math 2 / Algebra 1 & 2 content area titled: Unit 1 - Functions, Equations and Inequalities. The following slidepacks are included in this bundle:The Invisible Numbers of MathHow to Solve Math Word ProblemsSolving 1-Step and 2-Step Equations SolutionSolving 1-Step and Multi-Step Literal EquationsParallel and Perpendicular Lines Solution SummarySolving 1-Step and 2-Step Inequalitie
Subjects:
Grades:
9th - 12th
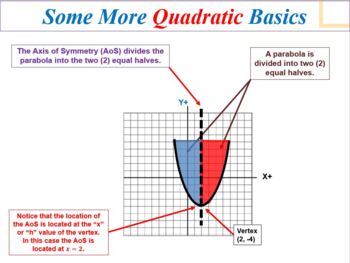
Math 2 / Algebra 1 & 2 Bundle - Unit 3 Quadratics
This bundle includes various instructional MS PowerPoint (PPT) slidepacks that I initially use when covering the Math 2 / Algebra 1 & 2 content area titled: Unit 3 - Quadratics. The following slidepacks are included in this bundle:Quadratic Functions TransformationsSolving Quadratic Equations - Factoring and the Zero Product PropertyConvert Quadratic Equations from Standard Form to Vertex Form and Vice VersaSolving Systems of Linear and Quadratic EquationsSolving Quadratic Equations - Quadr
Subjects:
Grades:
9th - 12th
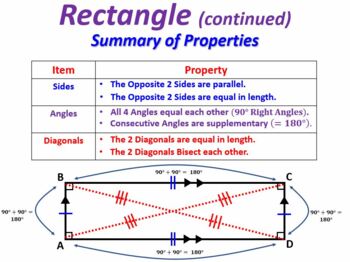
Math 3/Algebra 2 Bundle - Unit 8 Geometry (Quadrilaterals, Triangle & 3D Shapes)
This bundle includes various instructional MS PowerPoint (PPT) slidepacks that I initially use when covering the content area titled: Geometry (Quadrilaterals, Triangles and 3D Shapes). The following slidepacks are included in this bundle:Angle Type and Property SummarySummary of Triangle BasicsTriangle Congruence Solution SummaryRight Triangle Congruence Solution SummaryTriangle Similarity Solution SummarySpecial Triangles (30-60-90 and 45-45-90) Solution Summary4 Points of Triangle Concurrenc
Subjects:
Grades:
10th - 12th
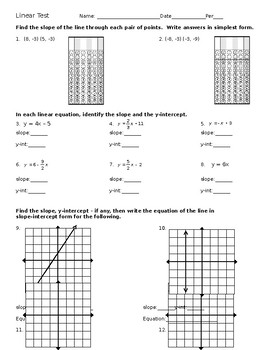
Linear Equations, Slope, X-Y Intercepts TEST - FULLY EDITABLE
WANT ALL 10 OF MY TESTS FOR ONLY $15? CLICK HERE: https://www.teacherspayteachers.com/Product/EDITABLE-8th-Grade-Tests-Bundle-CCSS-3904833THIS TEST:Test written for 8th grade class. Could use with a Pre-Algebra and Algebra class as well. 25 Questions (24 and a Bonus or make into 25). Graphs provided on test for students to show their work. Directions include:Find the slope of the line through each pair of points. In each linear equation, identify the slope and the y-intercept.Given the graph,
Grades:
7th - 9th
Types:
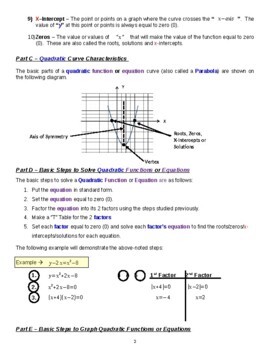
Math 1/Math 2/ Algebra 1 Quadratic Functions Calculation and Graphing Project
This activity involves the calculation, graphing and coloring of quadratic functions that have a leading coefficient = 1 only. I have my Algebra 1/Math 1/Math 2 students complete this project toward the end of the unit on quadratic functions.A total of ten (10) quadratic functions require solution and graphing by the students. A series of calculation sheets are first completed by the students following by an overall quadratic equation summary table. This is followed by the completion of ten (1
Grades:
8th - 11th
Types:
CCSS:
Showing 1-24 of 208 results


