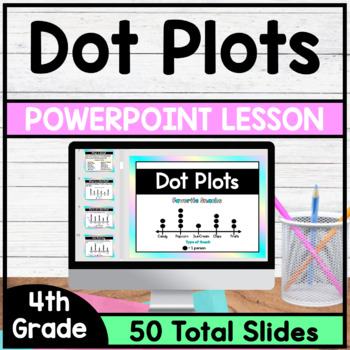
Dot Plots - PowerPoint Lesson
Also included in
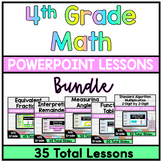
- This is a Bundle of my collection of my 4th Grade Math PowerPoint Lessons. These lessons cover a variety of 4th Grade Math Skills. *These PowerPoint Lessons have everything you need to teach a lesson. Just download and begin teaching, These lessons include Direct Instruction Slides, Guided PracticePrice $110.00Original Price $157.00Save $47.00
Description
This is a PowerPoint Lesson that focuses on Dot Plots. This PowerPoint Lesson goes through the complete lesson plan cycle. In this lesson students will learn about the parts of a dot plot and will understand how to summarize data on a dot plot.
*This PowerPoint Lesson has everything you need to teach a lesson. Just download and begin teaching. This lesson includes Direct Instruction Slides, Guided Practice Slides and Independent Practice Slides. (Printable Version of Guided Practice Questions and Independent Questions is Included in this Product)
*No need to create your lesson this PowerPoint is a full lesson ready to use!
What's Included?
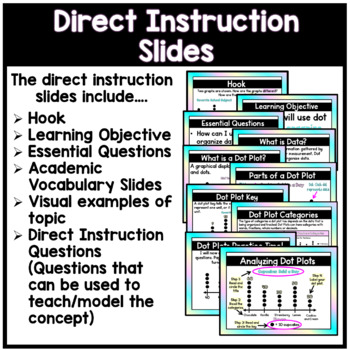
1.) Direct Instruction Slides – These slides include hook, learning objective, essential questions, vocabulary slides, visual examples of concept slides, 12 practice questions teaching slides.
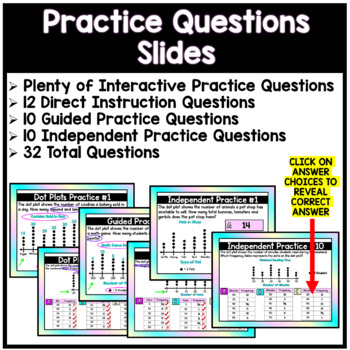
2.) Guided Practice Question Slides – 10 Total Interactive Guided Practice Questions
3.) Independent Practice Question Slides – 10 Total Independent Questions
4.) Blank Template Slides – This gives you the option to create your own questions.
5.) Dot Plots Anchor Chart
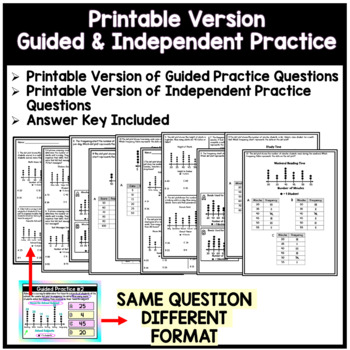
6.) Printable Version of Guided Practice and Independent Practice Questions
*THIS POWERPOINT IS NOT EDITABLE. HOWEVER I DID INCLUDE BLANK TEMPLATE SLIDES IF YOU WISH TO ADD MORE SLIDES TO THE PRESENTATION.
Common Core and TEKS Aligned Resource
TEKS 4.9A
The student is expected to: represent data on a frequency table, dot plot, or stem-and-leaf plot marked with whole numbers and fractions;
TEKS 4.9B
The student is expected to: solve one- and two-step problems using data in whole number, decimal, and fraction form in a frequency table, dot plot, or stem-and-leaf plot.
Common Core 4.MD.B.4
Make a line plot to display a data set of measurements in fractions of a unit (1/2, 1/4, 1/8). Solve problems involving addition and subtraction of fractions by using information presented in line plots. For example, from a line plot find and interpret the difference in length between the longest and shortest specimens in an insect collection.
*Questions? Comments? Suggestions You can reach me at: theallstarteacher@gmail.com

