Histograms and Frequency Tables (Powerpoint) for Busy Teachers
Thad Ackerman
184 Followers
Grade Levels
4th - 12th, Higher Education, Adult Education, Homeschool
Subjects
Resource Type
Formats Included
- PPT
Pages
21 pages
Thad Ackerman
184 Followers
Description
This powerpoint presentation introduces the concept of histograms and frequency tables.
Clipart, sounds, and animation are used sparingly and effectively to help illustrate points without being distracting. This powerpoint presentation has been extensively refined using faculty AND student input and feedback.
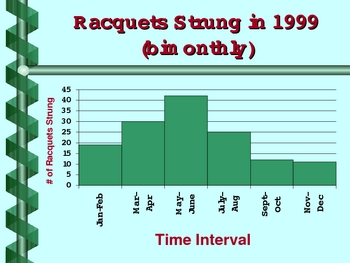
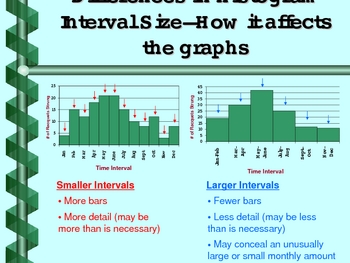
Definitions of histogram, interval, frequency table, and frequency are all presented. The progression from a frequency table to a completed histogram is illustrated and animated using real world data from a racquet stringing business called "All Strings Attached" in Portsmouth, NH. In addition, the effect of different interval sizes on the graph and on the precision of data is investigated.
Through this presentation, it is hoped that students will gain a solid foundation of understanding of histograms and frequency tables. Following this presentation, the goal is that students, with little coaching, will be able to create frequency tables and histograms of their own, given data or an activity in which they can collect their own data.
Thad's Resources for Busy Teachers
(click for complete & concise product/price list with links to all products)
Copyright (C) 2008 Thad J. Ackerman
This work is licensed under a Creative Commons Attribution-Noncommercial-Share Alike 3.0 United States License.
Total Pages
21 pages
Answer Key
Does not apply
Teaching Duration
N/A
Report this resource to TPT
Reported resources will be reviewed by our team. Report this resource to let us know if this resource violates TPT’s content guidelines.


