10 results
Graphing webquest microsofts
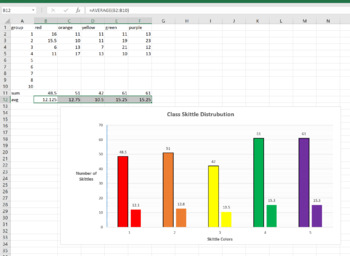
Skittle Statistics MS Excel Mini-Lab
This is a 1 class MS Excel lab for a computer or math class. You can have the students explore the distribution of different color Skittles in class. This is a great mini-lab or half-day activity when you school ends up with a weird schedule day. Tell them they can't eat till the Skittles till the end of class, or they will distort their numbers. Also make sure they don't throw them or shove them up their nose (Yes, stuck Skittles are hard to extract, ask me how I know..)The goal of this lab is
Grades:
6th - 12th, Higher Education, Adult Education
Types:
NGSS:
MS-ETS1-2
, HS-ETS1-2
, HS-ETS1-3
, MS-ETS1-4
, MS-ETS1-1
...
Also included in: Hands-on Science Semester Labs Bundle
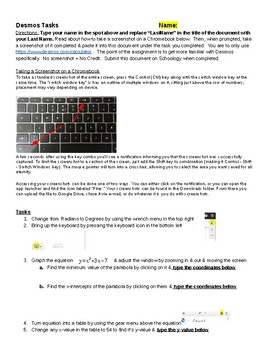
CAASPP Desmos Practice Tasks
The CAASPP test that our students take is a computer adaptive test that uses the Desmos Calculator (on problems that allow a calc). If your students do not use Desmos beforehand, they will be at a disadvantage. I put together these tasks to walk students through the various functions Desmos can complete. Students answer some questions & take some Screenshots to show the teacher they can now use Desmos. This activity is designed to be completed on a Chromebook or something similar. It is
Subjects:
Grades:
6th - 12th

Misleading Graph WebQuest
This editable Google Doc contains 10 questions and is to be used with the following website:5 Ways Writers Use Misleading Graphs To Manipulate YouI also recommend starting the lesson by showing the following YouTube videos:How to spot a misleading graphHow statistics can be misleading
Subjects:
Grades:
6th - 12th
CCSS:
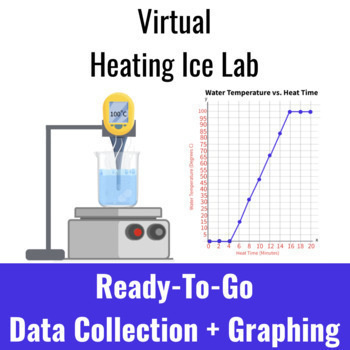
Virtual Heating ICE Lab, Graphing, NO PREP
Ready-to-Go Lesson on Graphing Temperature DataThis worksheet is designed to accompany the Virtual Science Teachers Heating Ice Lab as a guided practice for collecting, graphing, and analyzing data. If your students have access to computers, then this lesson is all ready to go! Just provide students the worksheet and a link to the interactive. Students record and graph the temperature measurements as the simulated beaker of ice melts and eventually boils. Students then use their graph to answe
Subjects:
Grades:
5th - 9th
Types:
NGSS:
MS-PS1-4
, MS-PS1-2
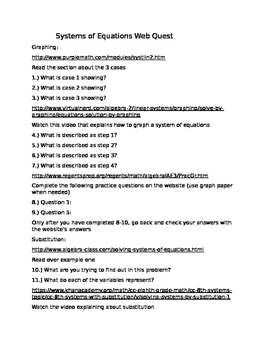
Systems of Equations Webquest
Looking for a fun way to incorporate technology into your classroom? Then this might be for you! This webquest includes links to reliable videos on sources like Khan Academy with questions to make sure your students are actually are learning something from the experience.:)
Grades:
6th - 10th
Types:
Coordinate Plane Practice
This was a perfect way to reintroduce my class to coordinate planes, they had so much fun plotting points and finding the ordered pair through this powerpoint, it is full of games, videos, a web quest, and some practice questions.
Was originally made for Google Slides, I would be happy to share the link with you after purchasing, just message me!
Grades:
3rd - 9th
Types:

Velocity vs. Time Graphs Activity (Inquiry Based)
This activity directs students to a website in which they can see motion being graphed in real-time and discover concepts individually.
Subjects:
Grades:
9th - 12th
Types:

Position vs. Time Graphs Activity (Inquiry Based)
This activity directs students to a website in which they can see motion being graphed in real-time and discover concepts individually.
Subjects:
Grades:
9th - 12th
Types:
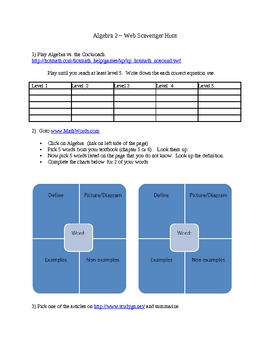
Algebra 2 Web Scavenger Hunt
Web scavenger Hunt for Algebra 2 students. Worksheet has 5 websites and activities to do on each of them. Webquest. Activities include Graphing, Vocabulary, Study Skill, Math History.
Subjects:
Grades:
7th - 12th
Types:
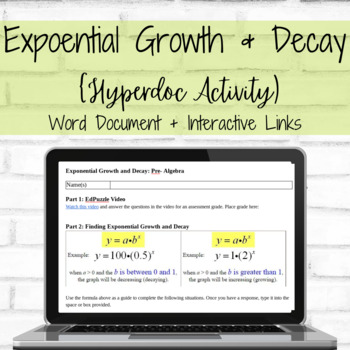
Exponential Growth and Decay Hyperdoc Activity
Students are introduced to exponential growth and decay through a Hyperdoc activity created in Google Docs. This activity will guide them through activities that connect prior knowledge, application questions, and formative assessments. This is a great tool for virtual learners or face to face learners. It is student paced and easy to grade. Students are able to collaborate with others if needed and see responses from their classmates on the Desmos activity. Students will remain in engaged with
Showing 1-10 of 10 results


