666 results
Graphing handout microsofts
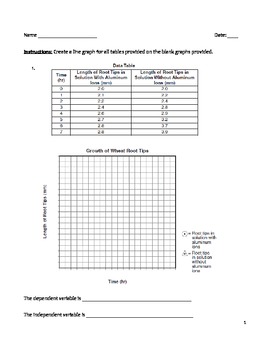
High School Science Graphing Worksheet - Making Line Graphs in Science
Use this worksheet to help your students practice making line graphs. In addition, they will have to identify both the independent and dependent variables. Hopefully, they will make the connection between the variables and their placement on the graph. There is a key provided for the teacher. There are ten line graphs for students to work with.
line graph, plot points, independent variable, dependent variable, data table, uniform scale, x-axis, y-axis
Subjects:
Grades:
8th - 12th
Types:
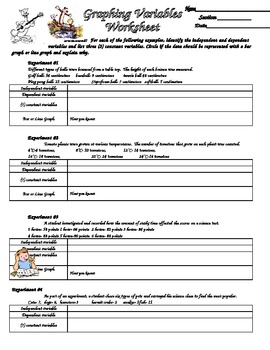
Scientific Method Variables and Graphing Practice
Students are given six different sets of experimental data and asked to identify the variables (independent, dependent etc.). They also reinforce graphing by identifying if the data should be represented with a bar or line graph. With this information, students the create data tables and graphs for the data.
Subjects:
Grades:
3rd - 12th
Types:
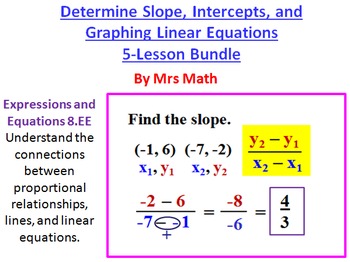
Slope, Intercepts, and Graphing Linear Equations Power Point 5 Lesson Pack
PDF and Microsoft word versions included.Are you looking for an all inclusive package that has everything you need to teach finding the slope, intercepts, and graphing equations? This is it! Lesson Power Points, classworks, homeworks, quizzes, a set of test questions, and even some teaching tips embedded in the lesson for instruction. If you are teaching this topic from scratch these resources will be a lifesaver. They can also be an excellent supplement to the resources you are already usin
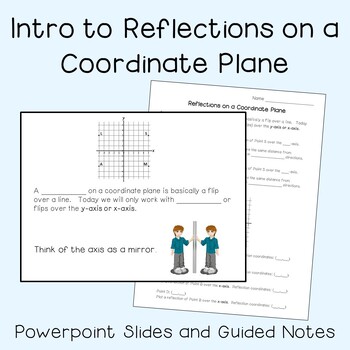
Intro to Reflections on a Coordinate Plane (6th Grade)
This is a basic introduction to reflections on a coordinate plane using only integers (no fractions or decimals). I use this with my scholars who have disabilities, especially learning disabilities.Update 11/4/2023: Now includes a separate guided notes page.See preview for everything that is included.Answers included in the notes section of the powerpoint.MAFS.6.NS.3.6 / CCSS.Math.Content.6.NS.C.6 Understand a rational number as a point on the number line. Extend number line diagrams and coord
Subjects:
Grades:
6th - 7th
Blank Editable Graphs
These are blank graphs that you can edit by typing in the name of the graph and whatever objects are being graphed. There are bar graphs, a pie graph, and a line graph template.
Subjects:
Grades:
K - 3rd
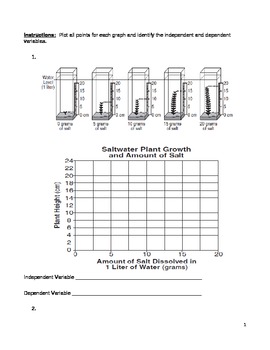
Middle School Math and Science Graphing Practice - Middle School Line Graphs
Use this resource to help your middle school math and science students learn and practice how to make line graphs as well as identify the independent and dependent variables. Move beyond bar graphs! There is a teacher key provided and eight graphs for practice.
line graph, plot points, x-axis, y-axis, independent variable, dependent variable
Subjects:
Grades:
5th - 9th
Types:
Create Population Pyramids!
OverviewStudents will understand how to read a population pyramid by creating one! This activity includes two templates to help your students create their own population pyramids, as well as population data for four countries from the U.S. Census Bureau's International Database. The activity includes blank cards if you or your students would like to create additional or specific population pyramids. Instructions are included to help navigate the U.S. Census Bureau's website in order to obtain th
Grades:
6th - 12th
Types:
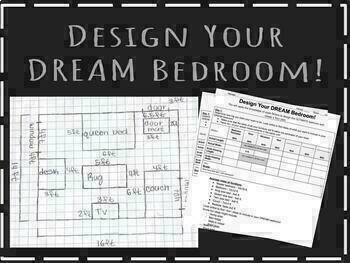
Fun Scale Drawing Project! (Minimal Prep)
Students will apply the knowledge of scale and scale factors to design their DREAM bedroom and create a floor plan! VERY MINIMAL PREP- all you have to do is print out the packets! Link for the project introduction Google slides included on the first page. Graph paper included on the third page.
Subjects:
Grades:
7th - 8th
Types:
CCSS:
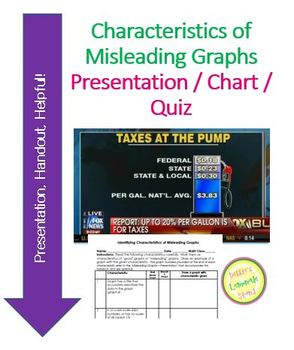
Misleading Graphs - Presentation, Graph Org, and Practice or Quiz
Having trouble finding resources on the topic Misleading Graphs! I did - which is what led me to create this resource. I have found it very useful in my classroom, I hope you do also!
One-stop shopping for all your misleading graph needs! 35-page PowerPoint presentation with examples of all kinds of misleading charts to aid in teaching and class discussion. Additionally included is a file that has a handout of misleading graph characteristics, as well as a quiz that can be used for instruct
Grades:
7th - 9th
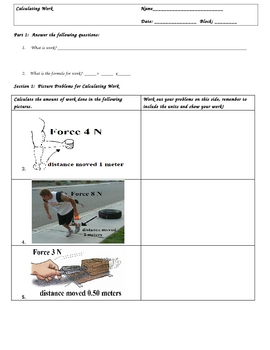
Calculating Work (W=Fxd) Worksheets and Key
Calculating Work (W=Fxd) Worksheets and KeyIf you have been teaching a Simple Machines or Energy Unit, then you need to check out this three page lesson to teach calculating work. It is in three sections.Section 1: Picture QuestionsSection 2: Word Problems/with Challenge QuestionsSection 3: Charting/Graphing ProblemsAll problems are worked out and the key is included.These worksheets include the renown Triangle Method, which has been a proven problem solver for students who struggle in math.The
Subjects:
Grades:
3rd - 12th, Higher Education, Adult Education
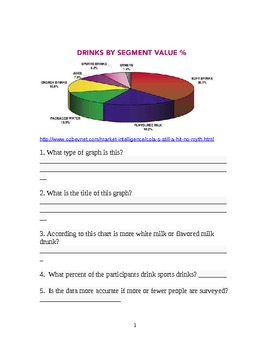
Charts and Graphs for Middle School
Included are thiry-eight graphs, charts, maps, flowcharts, tables and other graphics. These are real data maps taken from the Internet (all sources noted). Under each graphic are five questions that can be answered by using the information provided. The questions range from titles, mean, meadian, to create your own graph.
The pages can be copied back to back to make a workbook. I use this workbook as bellwork while I am taking attendance. Everyday the students answer the question. (I requi
Subjects:
Grades:
6th - 9th
Types:
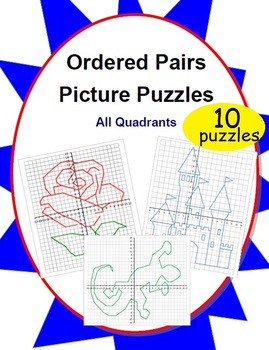
10 Ordered Pairs Mystery Picture Puzzles (All Quadrants)
10 original pictures perfect for any order pair puzzler. Start simple with a continuous connect-the-dot picture and graduate to more complex pictures composed of multiple sections. The built-in self-checking nature of creating a picture makes it easy for students to immediately assess their own progress.This 15-page PDF file includes:- 10 reproduction-ready original picture puzzles- An illustrated key so teachers can select appropriate puzzles based on student skill level and intended use- Numbe
Grades:
4th - 10th
Types:
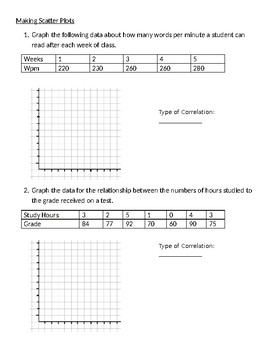
Making Scatter Plots Worksheet
2 pages of practice problems with given information to create scatter plots
Grades:
5th - 12th
Types:
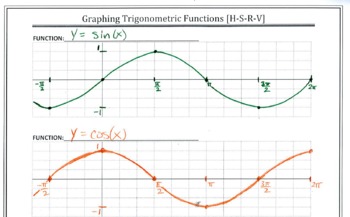
Graph Paper for Trig Functions
This changes everything! Student work becomes more consistent. Your grading will be so much easier! Using the four aligned graphs makes translations of trig functions crystal clear. This file has 2 pages of coordinate planes for graphing trig functions.The first page contains four blank graphs per page. The axes are unlabeled so that students may select their own scale.The second page has five blank graphs per page and is set up for conducting transformations on the coordinate plane.Please see
Subjects:
Grades:
10th - 12th, Higher Education, Adult Education
Interpreting Graphs and Charts
Students work with a variety of 25 graphs and charts and learn how to interpret the information provided. The format varies from one to the other: pie, column bar, horizontal bar, line/dot, and picture (volcano) graphs and table charts. Appropriate for math, Social Studies, ELA, ESL, and Spanish culture. Can be used in Gr. 6-12, adult education, college, and home school. All answer keys provided.
Grades:
6th - 11th, Higher Education, Adult Education
Types:
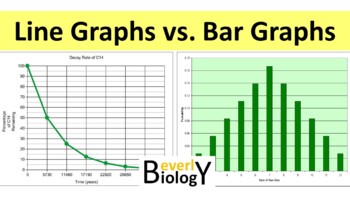
How to Make a Graph PowerPoint: Bar vs Line Graphing
This PowerPoint explains the basic properties of a line graph verses a bar graph. There is also a free handout included for your students to use as you present the lesson.This is NOT the typical bullet point PowerPoint. This is very much an animated, multimedia presentation filled with engaging images and animations to better enhance learning. Better yet! You can preview this entire PowerPoint prior to purchase on my YouTube channel to make sure it suits your needs:Preview on YouTubeThere are 3
Subjects:
Grades:
6th - 12th
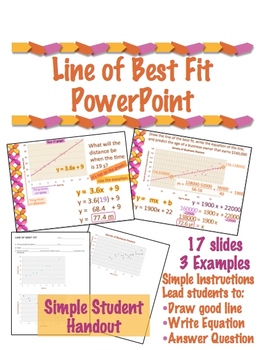
Line of Best Fit PowerPoint with Student Work Along Sheet
This is a zipped file that contains an 18 slide animated powerpoint and pdf & WORD versions of the student handout.
The FREE preview shows all the PowerPoint slides.
The standards shown are 11th grade Pennsylvania standards - easy to delete those 2 slides. (they are in addition to the 18 content slides)
The lesson gives pointers for drawing a good line, then 3 example of drawing lines, finding slopes, and writing the equation of the line.
There are 2 additional questions that use the
Subjects:
Grades:
9th - 11th

Pattern Blocks with Angle Measures
This is a student resource quick guide displaying angle measures of pattern blocks. An easy resource to print, laminate and share with your students! This supports New York Common Core Mathematics Grade 4: Module 4, Lessons 10 and 11. In these lessons, students use pattern blocks to create angle measures of 90, 180, 270 and 360 degrees. This resource is also great for Math centers!
Subjects:
Grades:
3rd - 6th
CCSS:
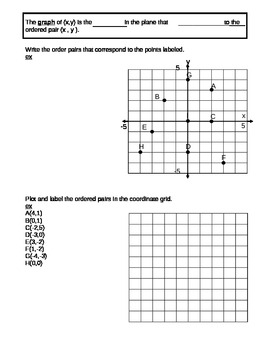
Coordinate Plane
This is a document that is used for guided notes for the Coordinate Plane. The notes practices how to plot points given ordered pairs, how to write the ordered pairs given the graph,and numbering the 4 quadrants.
Grades:
5th - 10th
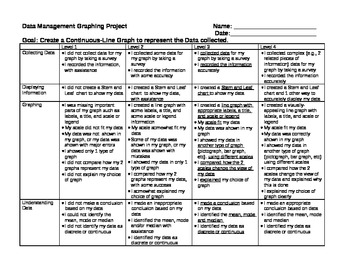
Grade 6 Graphing Project Rubric - Ontario
This is a rubric for a graphing project based on the Grade 6 Ontario Curriculum. It covers all points from the Grade 6 Data Management related to graphing (not probability), EXCEPT - determining how well the data represents a bigger population.
Download the preview to see a sample that one of my students made.
The project I did with my class was:
-collect data by doing a sample, research or experiment
-create a tally chart, stem and leaf plot, and t-chart showing the data
-create a continuou
Grades:
6th
Types:
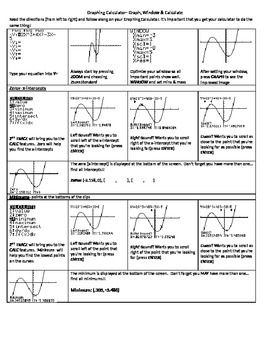
How to Graph on the Graphing Calculator
This is a worksheet designed to walk students through the process of Graphing functions, setting Windows, using tables, finding min, max, zeros, values & points of intersection with the Calculate feature. It gives directions and has screen shots so the students know what it should look like on their screen as they walk through the process. It is editable if you want to change something. It includes practice problems on what they just learned.
Made to work with TI-84 and TI-83
Subjects:
Grades:
9th - 12th
Types:
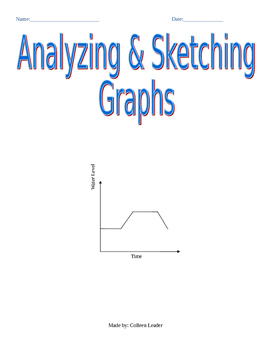
Analyzing & Sketching Graphs Lesson
This activity requires students to analyze qualitative graphs and explain what they represent. Some of the problems ask students to match scenarios to graphs, some require students to explain a graph in their own words, and finally the last problems ask students to construct a qualitative graph based on a description.
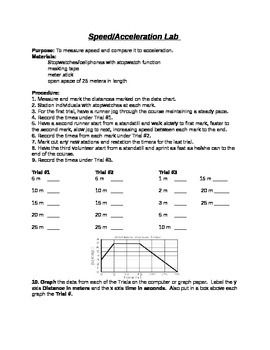
Speed/Acceleration Lab: Physical Science Activity to Measure and Graph Motion
This is an activity that involves the students in measuring, collecting data, calculations and graphing. This is done as a class with 8 timers, 3 volunteers to walk/run and a recorder. Volunteers are timed moving down the hallway and the time and distance data is used to create graphs showing constant speed/velocity and acceleration. Students have to calculate average speed and answer questions on how to identify the differences in movement on the graphs.
Subjects:
Grades:
7th - 10th
Types:
NGSS:
HS-PS2-1
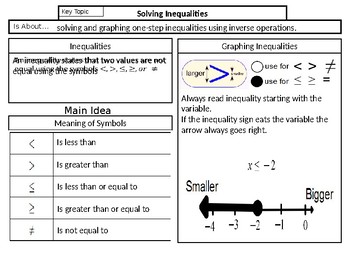
Solving and Graphing One and Two-Step Inequalities Notes SOL 7.13
7.13 The student will solve one- and two-step linear inequalities in one variable, including practical problems, involving addition, subtraction, multiplication, and division, and graph the solution on a number line.
Grades:
6th - 8th
Showing 1-24 of 666 results


