Graphing Galore! (PowerPoint presentation on data and graphing)
Dedicated Teacher 317
190 Followers
Grade Levels
6th - 9th, Homeschool
Subjects
Resource Type
Formats Included
- PPT
Pages
64 pages
Dedicated Teacher 317
190 Followers
Description
This is a PowerPoint presentation loaded with lots of graphing and data information. In this presentation students learn vocabulary, how to organize data, the difference between different types of graphs, how to set up different graphs, and there are examples for students to try on their own in order to check for understanding. This presentation includes the following information:
--Mean, Median, Mode, Range
--Outliers
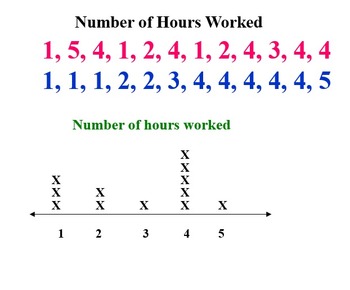
--Line Plots
--Frequency Tables
--Relative Frequency
--Histograms
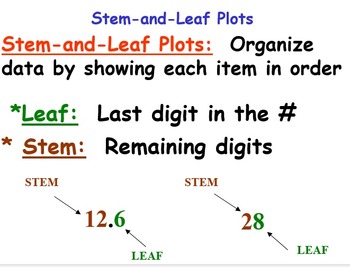
--Stem & Leaf Plots
--Bar, Line, and Circle Graphs
--Scatter Plots (with positive and negative correlations)
--Line of Best Fit
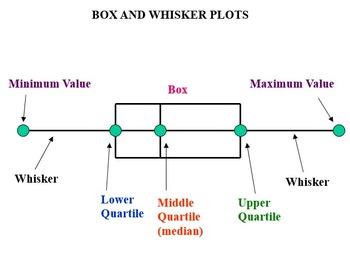
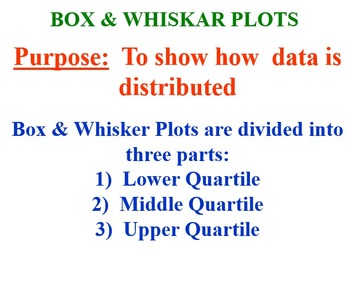
--Box and Whisker Plots
--Pictographs
--Mean, Median, Mode, Range
--Outliers
--Line Plots
--Frequency Tables
--Relative Frequency
--Histograms
--Stem & Leaf Plots
--Bar, Line, and Circle Graphs
--Scatter Plots (with positive and negative correlations)
--Line of Best Fit
--Box and Whisker Plots
--Pictographs
Total Pages
64 pages
Answer Key
Does not apply
Teaching Duration
1 Week
Report this resource to TPT
Reported resources will be reviewed by our team. Report this resource to let us know if this resource violates TPT’s content guidelines.


