16 results
Graphing lecture interactive whiteboards

Engage NY/Eureka Math Grade 6 Module 1 Lesson Pack
I have retyped and formatted all the student work pages from Engage NY/Eureka Math Grade 6 Module 1. This can be printed out in packet form or used digitally on a student device.
Subjects:
Grades:
6th
Logarithms & Their Graphs
This PowerPoint lesson shows students the properties of logarithms -- converting between logarithmic form and exponential form, evaluating logarithmic equations, and graphing logarithmic functions. This was designed for a Pre-Calculus class, so it has a lot of information in the one lesson since it would be a review for them. It could be used as an Algebra 2 lesson, but may need to be divided up into two or three lessons.
Subjects:
Grades:
10th - 12th, Higher Education
Exponential Functions & Their Graphs
This PowerPoint lesson was written for a Pre-Calculus class to review the graphs of exponential functions. It show examples of exponential growth and decay, and the graphs of each. It also has examples of compound interest and compounding continuously interest. It could be used as a unit review for Algebra 2, but would need to be broken into several units if used as new material.
NOTE: Math Type 5.0 was used to create this lesson.
Subjects:
Grades:
10th - 12th, Higher Education
Linear Functions and Slope Intercept Form
This resource includes:vocabularythe definition of slopethe types of slopeerror analysis how to write an equation in slope intercept formwrite the slope intercept form of the equation of the line through the given pointsgraphing slope intercept formhow to find b in slope intercept formgraphing lines in slope intercept formstandard to slope intercept formslope intercept form from graphThis resource is on a white background so that it can be modified by the teacher, or uploaded to SMART, Promethea
Grades:
10th - 12th
CCSS:

Using Models to Represent Ratios and Rates! SmartBoard Lesson / Scaffold Notes
In this SmartBoard lesson, students will learn how number lines, charts, tables and graphs can be used to represent unit rates, rates and ratios. Students will be given examples of how ratios are placed in tables/charts to see relationships and solve for unknowns. Students will see how double number lines are also used to represent rates and ratios. Lastly, students will see how line graphs, using x and y along with points can represent ratios and rates. There are examples of each for the class
Subjects:
Grades:
5th - 7th

Creating Bar Graphs
This is a math lesson on learning to create bar graphs. It is geared for 3rd graders and meets the Georgia Performance (GPS) standards for math. This lesson has 7 slides and includes an essential question, an internet link, and a summarizing activity. It is designed to be an introduction to this topic and provide guided practice.
Subjects:
Grades:
2nd - 4th

Collecting Data Smartboard Lesson
This is a math lesson on tally tables, frequency tables, and collecting data. It is geared for 3rd graders and meets the Georgia Performance (GPS) standards for math. This lesson has 9 slides and includes an essential question and a summarizing activity. It is designed to be an introduction to this topic and provide guided practice.
Subjects:
Grades:
1st - 3rd

Using Data
This is a math lesson on interpreting results (data) from a survey. It is geared for 3rd graders and meets the Georgia Performance (GPS) standards for math. This lesson has 8 slides and includes an essential question and a summarizing activity. It is designed to be an introduction to this topic and provide guided practice.
Subjects:
Grades:
1st - 3rd

Using and Creating Grids
This is a math lesson on creating and using grids and ordered pairs. It is geared for 3rd graders. This lesson has 7 slides and includes an essential question lots of practice for students. It is designed to be an introduction to this topic and provide guided practice.
Subjects:
Grades:
1st - 4th
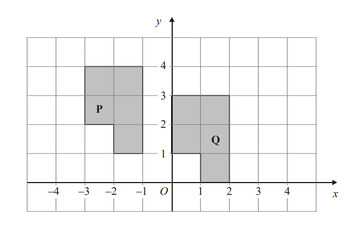
Midpoint of a Line, Translation and Reflection of 2D Shapes. PPT File
This is a power point presentation that covers the topic midpoint of a line segment, the coordinate of a point that lies a fraction of a line segment. Translation of 2D shapes with examples that cover performing the translation and describing the translation.Reflection of 2D shapes with examples that cover performing the reflection and describing the reflection.
Alg 2 -- Graphing Square & Cube Roots
This is a PowerPoint lesson to show how to graph square roots and cube roots. Transformations are explained also.
Subjects:
Grades:
10th - 12th, Higher Education

Prealgebra Graphing Concepts
This notebook file was created for 7th and 8th grade English Language Learners in a study skills class. The document goes step by step through
- GRAPHING VOCABULARY
-GRAPHING SKILLS
-PRIME FACTORIZATION
-GREATEST COMMON FACTOR
The smartboard document allows for ample student participation as they answer questions both on the smartboard and on their papers.
Subjects:
Grades:
5th - 9th

Finding Slope Foldable
This is a notebook file which contains how to create a foldable to help teach students 2 different ways to find the slope.
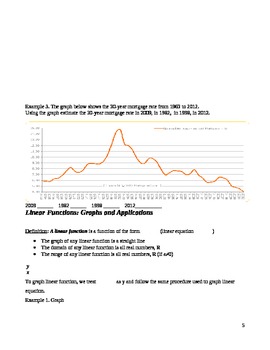
Graphs and function notation
The lecture includes topics: graphs of line, function notation. It can be used as review or as a lesson to introduce function notation. The examples are practical and last one is real life application of using graphs and functions. In general, it gives overview of graphs and functions as special kind of relations.
In case students are confused how to determine is relation a function or not, I suggest the following approach.
Let consider each element of domain represent a child and each element
Subjects:
Grades:
9th - 12th, Higher Education
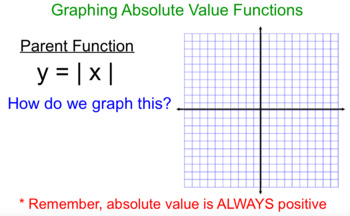
Graphing Absolute Value Function Notes
Editable Smart Notebook file on the process of graphing absolute value functions. Teacher-led with student practice problems included.
Grades:
7th - 10th

Graphing Calculator Preview - Getting to Know the Graphing Calculator
This is a basic lesson concerned with introducing students to the most frequently used special keys on the TI graphing calculators. This file is the presentation used.
Subjects:
Grades:
7th - 12th
Types:
Showing 1-16 of 16 results


