Introduction to Functions
Mistah Seaver
2 Followers
Resource Type
Standards
CCSS6.EE.C.9
CCSS8.EE.B.5
Formats Included
- PPTX
Pages
9 pages
Mistah Seaver
2 Followers
Description
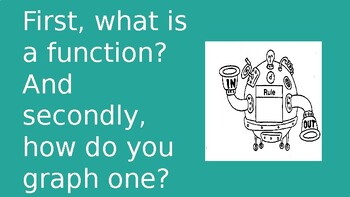
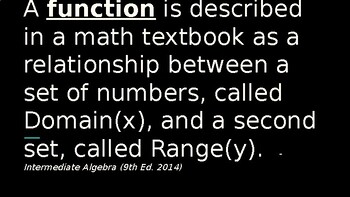
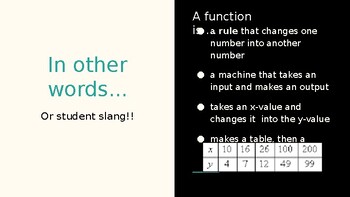
A power-point presentation about "Graphing Functions". Slides show other terms associated with functions, provide student friendly descriptions of terms, pictures, examples, video links, etc.
Total Pages
9 pages
Answer Key
N/A
Teaching Duration
30 minutes
Report this resource to TPT
Reported resources will be reviewed by our team. Report this resource to let us know if this resource violates TPT’s content guidelines.
Standards
to see state-specific standards (only available in the US).
CCSS6.EE.C.9
Use variables to represent two quantities in a real-world problem that change in relationship to one another; write an equation to express one quantity, thought of as the dependent variable, in terms of the other quantity, thought of as the independent variable. Analyze the relationship between the dependent and independent variables using graphs and tables, and relate these to the equation. For example, in a problem involving motion at constant speed, list and graph ordered pairs of distances and times, and write the equation 𝘥 = 65𝘵 to represent the relationship between distance and time.
CCSS8.EE.B.5
Graph proportional relationships, interpreting the unit rate as the slope of the graph. Compare two different proportional relationships represented in different ways. For example, compare a distance-time graph to a distance-time equation to determine which of two moving objects has greater speed.


