64 results
Graphing classroom form microsofts
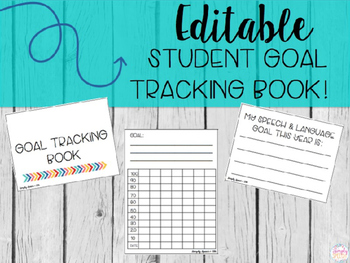
Editable Student Goal Tracking Book
These mini goal books are the perfect way to help your students keep track of their own goals. These books help increase student motivation and self awareness as they create their own personal goals and track their own progress.Here's what's included:Page 3: cover page options. This page is editable. Click on 'add text box' to add your students' names to their books.Page 4: Goal tracking sheets. Print as many of these pages as you need. This is also editable if you wish to type the goals in. Pag
Subjects:
Grades:
1st - 12th
*Digital Student DATA / Personal Binder Google Sheets hybrid - virtual - Zoom
Completely ***EDITABLE***Using student data binders encourages students to take ownership of their data. It is simple and easy to use this student binder and a wonderful way for students to have data chats at their Student Led Conferences. This Ultimate Student Data Binder is what you need to get started this year! Use this with your students in the classroom or virtually. Works great with Google classroom and zoom! No more graphing in a binder and printing out hundreds of papers for their binde
Subjects:
Grades:
Not Grade Specific
Types:
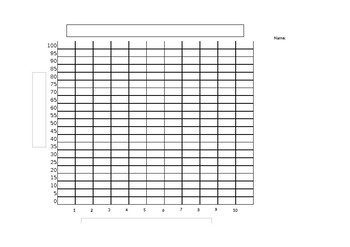
Blank (line or bar) Graph
This product can be for multiple uses! It contains a numbered x and y axis, a blank heading for students to write in a title, and blank headings for axis labels.I used the blank graph for my students to graph their test scores and then mark their goal for their next test creating an accountability factor for testing.
Grades:
Not Grade Specific
Graphed Behavior Data Spreadsheet (Pre-Dated 2023-24 School Year)
Easily Graph student behavior data with this pre-formatted Excel spreadsheet. Simply enter the students' data in the spreadsheet and the document creates a colorful data graph. There is a spreadsheet and data graph pre-populated for each weekday of the 2023-2024 school year.
Subjects:
Grades:
Not Grade Specific
Types:

History of animation
History of animation includes key years for development of cartoons. At the end of the presentation there are several questions for practicing speaking with the students and activities where students should answer with yes or no to the statements and the one where students should perform research and come up with their versions of history of animation or their favourite cartoons (I am recommeding research task as a homework).
Subjects:
Grades:
5th - 6th

Graphing colors/Recording data
Graphing colors. Great for sorting/graphing manipulatives.Recording data
Subjects:
Grades:
PreK - 2nd
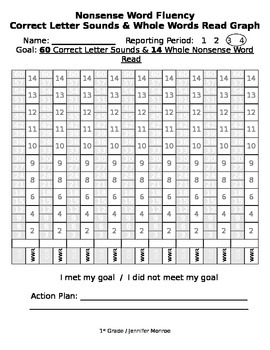
Nonsense Word Fluency Graphs aligned with DIBELS Benchmark Goals Common Core
This is a wonderful tool to show students their gains in reading as you progress monitor them using DIBELS Next or any other fluency assessments. This graph is to be used during the 3rd and 4th nine weeks, as the goals are aligned with the benchmark goals for DIBELS Next. There is nine weeks worth of graphing space if you progress monitor your students every other week. The first column allows the students to graph how many Correct Letter Sounds they read in 1 minute. The second column has them
Grades:
1st
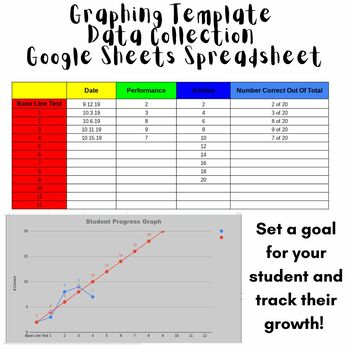
Data Collection Graph Template - Great for IEP GOALS!
Organize your data for students GOALS! Great way to TRACK and show GROWTH for progress monitoring with IEP GOALS, or really...any goals your students have! This is a spreadsheet set up for google sheets. All you need to do is enter the students information, their goal, and start tracking! Enter each time you test a student how they do, and a graph will be generated.
Subjects:
Grades:
Not Grade Specific
Types:
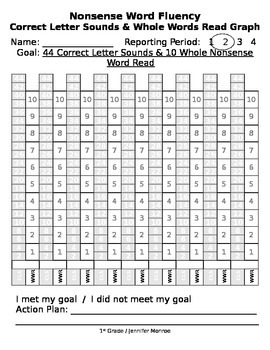
Nonsense Word Fluency Graphs Aligned with DIBELS Benchmark Goals Common Core
This is a wonderful tool to show students their gains in reading as you progress monitor them using DIBELS Next or any other fluency assessments. This graph is to be used during the 1st and 2nd nine weeks, as the goals are aligned with the benchmark goals for DIBELS Next. There is nine weeks worth of graphing space if you progress monitor your students every other week. The first column allows the students to graph how many Correct Letter Sounds they read in 1 minute. The second column has t
Grades:
1st
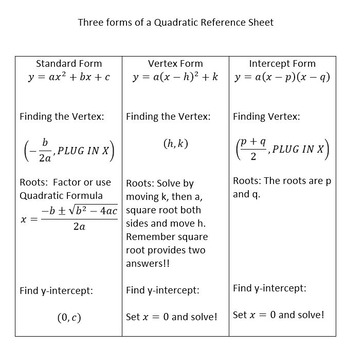
Quadratic Equation (Forms) Reference Sheet
All three forms laid out side by side. For each of three forms (Standard, Vertex and Intercept) this sheet shows how to find the vertex, the roots and the y-intercept for each.
Print on card stock and have kids practice with the "green" sheet (or whatever color you choose).
Subjects:
Grades:
9th - 11th
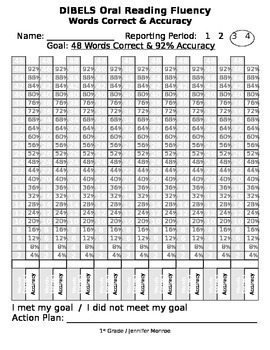
Oral Reading Fluency Words Correct and Accuracy Graphs aligned with DIBELS goals
This is a wonderful tool to show students their gains in reading as you progress monitor them using DIBELS Next or any other fluency assessments. This graph is to be used during the 3rd and 4th nine weeks, as the goals are aligned with the benchmark goals for DIBELS Next. There is nine weeks worth of graphing space if you progress monitor your students every other week. The first column allows the students to graph how many Words Correct they read in 1 minute. The second column has them graph wh
Grades:
1st
Math Grid Notebook For School Editable
Math Grid Notebook for School EditableKids can learn number writing, addition, subtraction and multiplication.Hight school students can use it for graph, Coordinates etc.Size = Letter size 8.5" X 11"With and without margin.Black and white and in blue color.Ask me I will change the color.
Grades:
Not Grade Specific
Types:
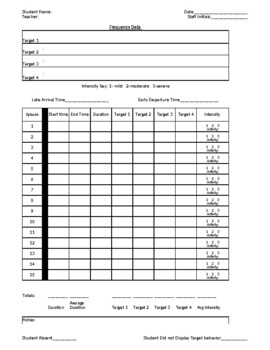
Behavior Frequency Rate Chart w/ Target, Intensity, Duration, BIP chart/Summary
Behavior Frequency Rate Chart (dates and chart cant be edited and dates changed to current year or target)--Daily Sheet-Date Entry-Intensity Chart-Duration Chart-Target Charts-BIP Evaluation printout -BIP write upSee preview for description Excel format for editing - tabs at bottom of page for easy change of view and data entry
Subjects:
Grades:
PreK - 12th
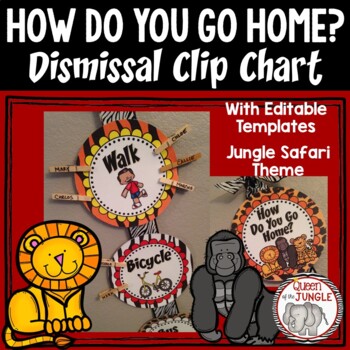
How Do You Go Home Dismissal Clip Chart and Math Graphing
Do you need a way to organize and keep track of how your students will be going home at the end of the day? This Dismissal Transportation Clip Chart is perfect to post by your door so you can see at a glance who rides the bus, is picked up in carpool line or walks home. If a student’s transportation method changes at any time during the year, simply move their clip. This clip chart helps teachers during dismissal and is also a great reference for substitutes. Also included is a fun Math Graphi
Subjects:
Grades:
PreK - 5th
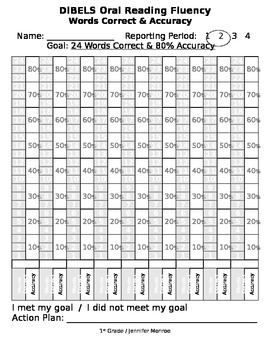
Oral Reading Fluency Words Correct and Accuracy Graphs aligned with DIBELS goals
This is a wonderful tool to show students their gains in reading as you progress monitor them using DIBELS Next or any other fluency assessments. This graph is to be used during the 1st and 2nd nine weeks, as the goals are aligned with the benchmark goals for DIBELS Next. There is nine weeks worth of graphing space if you progress monitor your students every other week. The first column allows the students to graph how many Words Correct they read in 1 minute. The second column has them graph wh
Grades:
1st

Lost Tooth Club Pack
NEWLY UPDATED!! This product is great to use when a student loses a tooth. We all know this is an exciting time in our young students lives and they will love being celebrated!This pack includes:-A class tally chart (math connection!) that students can fill in as they lose teeth. It is fun by the end of the year to see how many teeth were lost in the school year and what month was the most popular month to lose a tooth.-Two certificate options to give to the student with a line for their name an
Subjects:
Grades:
K - 2nd
Types:

Reading Log **EDITABLE**
A home reading log that allows students and parents and teachers to track student's reading efficiently. Allows for measurement, graphing and numeration practice at school. Simple enough for busy parents.
Subjects:
Grades:
K - 3rd
Types:
How do we get home?
This is a great little packet that helps you and your students understand how they go home daily. It will serve as a great reminder tool for you to know where each student goes after they leave your room. Math can also be tied in to this packet by having your own students graph how they will get home. I have included editable name badges in two sizes that allow you to type in each students name, their phone number, address, and how they will get home.
This is a lifelong tool that can be used ye
Subjects:
Grades:
PreK - 3rd
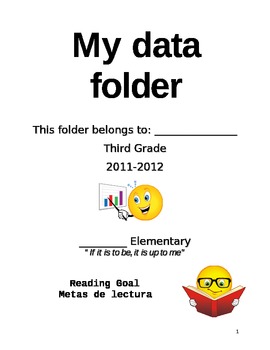
Data Folder - Student version
This is a 21 pages long data folder for reading and math. Students can graph, weekly, their date in each of these subjects. Keeping track of their grades makes them be responsible by taking ownership.
I uploaded the .doc file so you can edit the school name, grade level and school year.
English and Spanish
Subjects:
Grades:
2nd - 4th
Types:
Daily Math
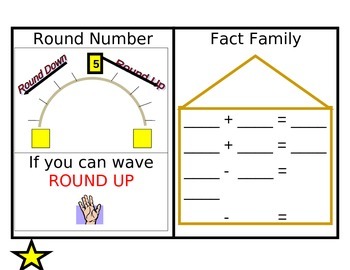
This is an awesome spiral review of 2nd grade math concepts.
Includes:
a weekly schedule
number of the week
place value 4 square
number line
tally marks
hundred chart
more/ less
even or odd
number before/after
rounding
fact family
graphing
telling time
money
fractions
missing addend, sum
missing subtrahend, difference
minute, second, hour
weight: ounce, pound, ton
length: inches, feet, yards
capacity
Subjects:
Grades:
1st - 3rd
Types:
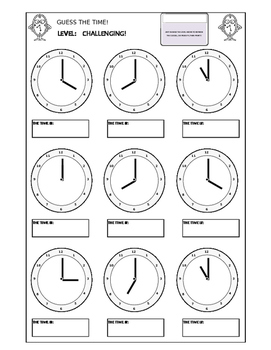
Clocks - Guess The Time
An easy way to produce hundreds of clock worksheets so that your students can practice working out the time. This is an Excel worksheet with 9 clocks, that refresh randomly to produce any number of random print outs.
There are three levels (Challenging, Really Hard, and Nightmarish!), corresponding to Easy (K, G1), Medium (G2, G3) and Hard (G4, G5). You only have to change levels or refresh the page (F9 for a PC) and you have a new sheet.
Tab 1 ("GUESS") is for guessing the time from a clock.
Subjects:
Grades:
K - 7th
Types:
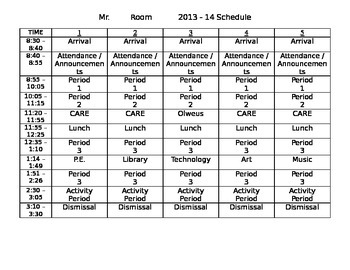
Student Schedule for Beginning of school year
At the beginning of every year, I like to give each student and parent a copy of the weekly schedule. Some schedules are tougher for students than others, being that some years we have had 6 versus 5 days.
This is a schedule that I have used because it is "kid-friendly" and clearly shows what class the students are to be in at any given time. I currently have this schedule listed with "Periods" versus specific classes, but that can be easily changed to reflect your class(es). The schedule is
Grades:
3rd - 8th
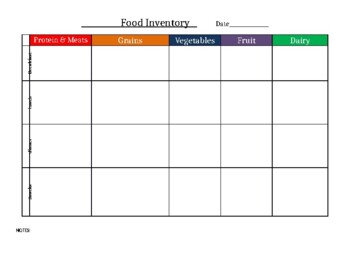
Food Inventory Daily Food and Nutrition Chart/Tracker
Food Inventory Daily Food and Nutrition Chart/TrackerSee preview for setup!
Subjects:
Grades:
PreK - 12th
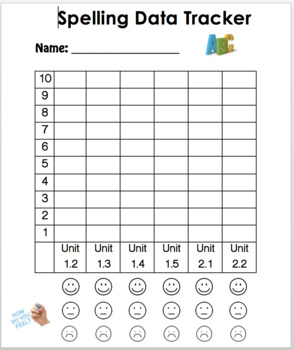
Spelling Data Tracker
Best suited for 1st grade simply because it doesn't deal with percentages rather than number of words on their spelling test (10). This was made with McGraw Hill WONDERS in mind. After students take their spelling test and it's corrected, students track/graph their scores. Great for self monitoring, intrinsic motivation, goal setting, and data collecting. Also allows students to reflect and hopefully be in tune with their feelings.
Grades:
K - 2nd
Types:
Showing 1-24 of 64 results


